Hasbro 2014 Annual Report Download - page 108
Download and view the complete annual report
Please find page 108 of the 2014 Hasbro annual report below. You can navigate through the pages in the report by either clicking on the pages listed below, or by using the keyword search tool below to find specific information within the annual report.-
 1
1 -
2
-
3
-
4
-
5
-
6
-
7
-
8
-
9
-
10
-
11
-
12
-
13
-
14
-
15
-
16
-
17
-
18
-
19
-
20
-
21
-
22
-
23
-
24
-
25
-
26
-
27
-
28
-
29
-
30
-
31
-
32
-
33
-
34
-
35
-
36
-
37
-
38
-
39
-
40
-
41
-
42
-
43
-
44
-
45
-
46
-
47
-
48
-
49
-
50
-
51
-
52
-
53
-
54
-
55
-
56
-
57
-
58
-
59
-
60
-
61
-
62
-
63
-
64
-
65
-
66
-
67
-
68
-
69
-
70
-
71
-
72
-
73
-
74
-
75
-
76
-
77
-
78
-
79
-
80
-
81
-
82
-
83
-
84
-
85
-
86
-
87
-
88
-
89
-
90
-
91
-
92
-
93
-
94
-
95
-
96
-
97
-
 98
98 -
 99
99 -
 100
100 -
 101
101 -
 102
102 -
 103
103 -
 104
104 -
 105
105 -
 106
106 -
 107
107 -
 108
108 -
 109
109 -
 110
110 -
 111
111 -
 112
112 -
 113
113 -
 114
114 -
 115
115 -
 116
116 -
 117
117 -
 118
118 -
119
-
120
-
121
-
122
-
123
-
124
-
125
-
126
-
127
 |
 |

HASBRO, INC. AND SUBSIDIARIES
Notes to Consolidated Financial Statements — (Continued)
(Thousands of Dollars and Shares Except Per Share Data)
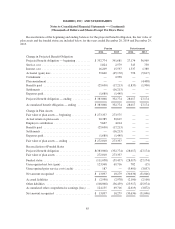
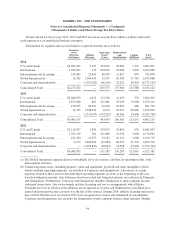
Results shown for fiscal years 2014, 2013 and 2012 are not necessarily those which would be achieved if
each segment was an unaffiliated business enterprise.
Information by segment and a reconciliation to reported amounts are as follows:
Revenues
from
External
Customers
Affiliate
Revenue
Operating
Profit
(Loss)
Depreciation
and
Amortization
Capital
Additions
Total
Assets
2014
U.S. and Canada ................ $2,022,443 5,957 334,702 20,689 1,131 3,663,497
International ................... 2,022,997 170 270,505 23,086 3,063 2,422,046
Entertainment and Licensing ...... 219,465 22,401 60,550 21,827 807 783,878
Global Operations(a) ............ 12,302 1,564,654 15,767 69,442 71,763 2,433,888
Corporate and eliminations(b) ..... — (1,593,182) (46,149) 22,922 36,624 (4,771,167)
Consolidated Total .............. $4,277,207 — 635,375 157,966 113,388 4,532,142
2013
U.S. and Canada ................ $2,006,079 4,412 313,746 21,459 553 3,066,301
International ................... 1,872,980 401 235,482 25,036 13,908 2,233,115
Entertainment and Licensing ...... 190,955 20,521 45,476 22,647 468 691,795
Global Operations(a) ............ 12,143 1,508,303 6,712 65,477 62,696 2,172,816
Corporate and eliminations(b) ..... — (1,533,637) (134,323) 46,366 34,406 (3,761,760)
Consolidated Total .............. $4,082,157 — 467,093 180,985 112,031 4,402,267
2012
U.S. and Canada ................ $2,116,297 5,309 319,072 24,899 629 6,041,893
International ................... 1,782,119 381 215,489 21,534 5,000 2,176,021
Entertainment and Licensing ...... 181,430 10,559 53,191 16,123 1,064 1,164,715
Global Operations(a) ............ 9,137 1,480,582 (15,964) 66,053 61,770 2,493,976
Corporate and eliminations(b) ..... — (1,496,831) (20,003) 21,678 43,628 (7,551,218)
Consolidated Total .............. $4,088,983 — 551,785 150,287 112,091 4,325,387
(a) The Global Operations segment derives substantially all of its revenues, and thus its operating results, from
intersegment activities.
(b) Certain long-term assets, including property, plant and equipment, goodwill and other intangibles, which
benefit multiple operating segments, are included in Corporate and eliminations. Allocations of certain
expenses related to these assets to the individual operating segments are done at the beginning of the year
based on budgeted amounts. Any differences between actual and budgeted amounts are reflected in Corporate
and eliminations. Furthermore, Corporate and eliminations includes elimination of inter-company income
statement transactions. One such example includes licensing and service arrangements with affiliates.
Payments received in advance from affiliates are recognized as revenue and eliminated in consolidation as
earned and payment becomes assured over the life of the contract. During 2014, affiliate licensing and service
fees of $541,036 that were received in 2013 were recognized as revenue and eliminated in consolidation.
Corporate and eliminations also includes the elimination of inter-company balance sheet amounts. During
94