Hasbro 2014 Annual Report Download - page 55
Download and view the complete annual report
Please find page 55 of the 2014 Hasbro annual report below. You can navigate through the pages in the report by either clicking on the pages listed below, or by using the keyword search tool below to find specific information within the annual report.-
 1
1 -
2
-
3
-
4
-
5
-
6
-
7
-
8
-
9
-
10
-
11
-
12
-
13
-
14
-
15
-
16
-
17
-
18
-
19
-
20
-
21
-
22
-
23
-
24
-
25
-
26
-
27
-
28
-
29
-
30
-
31
-
32
-
33
-
34
-
35
-
36
-
37
-
38
-
39
-
40
-
41
-
42
-
43
-
44
-
 45
45 -
 46
46 -
 47
47 -
 48
48 -
 49
49 -
 50
50 -
 51
51 -
 52
52 -
 53
53 -
 54
54 -
 55
55 -
 56
56 -
 57
57 -
 58
58 -
 59
59 -
 60
60 -
 61
61 -
 62
62 -
 63
63 -
 64
64 -
 65
65 -
66
-
67
-
68
-
69
-
70
-
71
-
72
-
73
-
74
-
75
-
76
-
77
-
78
-
79
-
80
-
81
-
82
-
83
-
84
-
85
-
86
-
87
-
88
-
89
-
90
-
91
-
92
-
93
-
94
-
95
-
96
-
97
-
98
-
99
-
100
-
101
-
102
-
103
-
104
-
105
-
106
-
107
-
108
-
109
-
110
-
111
-
112
-
113
-
114
-
115
-
116
-
117
-
118
-
119
-
120
-
121
-
122
-
123
-
124
-
125
-
126
-
127
 |
 |

agreement with Disney. The Company will continue to incur these development costs related to these properties
in 2015 in advance of the commencement of the license period and product shipments in 2016.
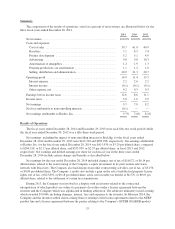
Advertising expense in 2014 totaled $420,256 compared to $398,098 in 2013 and $422,239 in 2012. The
level of the Company’s advertising expense can generally be impacted by revenue mix, the amount and type of
theatrical releases, and television programming. Advertising expense was consistent as a percentage of net
revenues in 2014 and 2013 at 9.8% of net revenues and decreased from 10.3% of net revenues in 2012. The
increase in advertising expense in 2014 compared to 2013 was primarily due to higher net revenues. The
decrease in advertising expense in 2013 compared to 2012 was the result of the mix of 2013 net revenues as well
as a higher portion of our spending in digital formats.
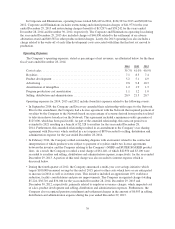
Amortization of intangibles totaled $52,708, or 1.2% of net revenues, in 2014 compared to $78,186, or 1.9%
of net revenues, in 2013 and $50,569, or 1.3% of net revenues, in 2012. Amortization of intangibles in 2013
includes $19,736 related to impairment of definite-lived intangibles based on the Company’s decision to exit the
related product lines. Absent the impact of these charges, amortization of intangibles was $58,450, or 1.4% of net
revenues, in 2013. Lower amortization of intangibles in 2014 compared to 2013 reflects the impact of intangible
assets which were fully amortized during 2013. Higher amortization of intangibles in 2013 compared to 2012
reflects the acquisition of Backflip in 2013.
Program production cost amortization totaled $47,086, or 1.1% of net revenues, in 2014 compared to
$47,690, or 1.2% of net revenues, in 2013 and $41,800, or 1.0% of net revenues, in 2012. Program production
costs are capitalized as incurred and amortized using the individual-film-forecast method. Program production
cost amortization reflects the level of revenues associated with television programming as well as the type of
television programs produced and distributed.
Selling, distribution and administration expenses totaled $895,537, or 20.9% of net revenues, in 2014
compared to $871,679, or 21.3% of net revenues, in 2013 and $847,347, or 20.7% of net revenues, in 2012.
Selling, distribution and administration expense for 2014, 2013 and 2012 includes $6,094, $32,547 and $33,463,
respectively, of charges related to restructuring activities, including the Company’s equity investment in the joint
venture television network, and legal costs associated with the arbitration settlement. Excluding these charges,
selling, distribution and administration expense increased to $889,443, or 20.8% of net revenues, in 2014 from
$839,132, or 20.6% of net revenues, in 2013 and $813,884, or 19.9% of net revenues, in 2012. Higher selling,
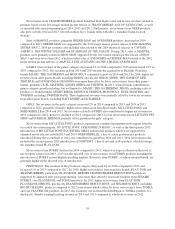
distribution and administration expenses in 2014 compared to 2013 reflects continued investment in emerging
markets and certain brands, primarily MAGIC: THE GATHERING, a full year of expense related to Backflip,
higher performance-based stock compensation and increased depreciation expense associated with investments in
information systems. The increase in 2013 compared to 2012 reflected investments in emerging markets,
information systems, new facilities, and certain brands, including MAGIC: THE GATHERING and the
acquisition of Backflip in the third quarter of 2013. Higher compensation and legal expenses also contributed to
the increase in 2013. These investments and higher costs in 2013 more than offset savings, primarily from
headcount reductions, resulting from our cost savings initiatives.
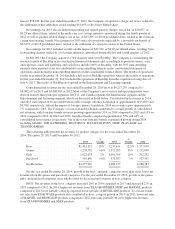
Interest Expense
Interest expense totaled $93,098 in 2014 compared to $105,585 in 2013 and $91,141 in 2012. Interest
expense in 2013 included approximately $15,090 related to the settlement of an arbitration award. Absent these
charges, interest expense totaled $90,495 in 2013. The increase in interest expense in 2014 compared to the 2013
adjusted total was primarily due to higher benefits from interest rate swap agreements in 2013, partially offset by
the benefit of lower interest rates on long-term debt.
Interest Income
Interest income was $3,759 compared to $4,925 in 2013 and $6,333 in 2012. Decreased interest income in
2014 compared to 2013 reflects lower average cash balances while decreased interest income in 2013 compared
to 2012 reflects lower average interest rates. Average interest rates for 2014 and 2013 were consistent.
41