Hasbro 2014 Annual Report Download - page 110
Download and view the complete annual report
Please find page 110 of the 2014 Hasbro annual report below. You can navigate through the pages in the report by either clicking on the pages listed below, or by using the keyword search tool below to find specific information within the annual report.
HASBRO, INC. AND SUBSIDIARIES
Notes to Consolidated Financial Statements — (Continued)
(Thousands of Dollars and Shares Except Per Share Data)
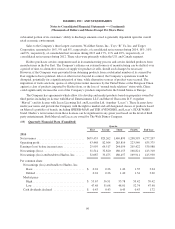
substantial portion of its customers’ ability to discharge amounts owed is generally dependent upon the overall
retail economic environment.
Sales to the Company’s three largest customers, Wal-Mart Stores, Inc., Toys “R” Us, Inc. and Target
Corporation, amounted to 16%, 9% and 8%, respectively, of consolidated net revenues during 2014, 16%, 10%
and 9%, respectively, of consolidated net revenues during 2013 and 17%, 11% and 10%, respectively, of
consolidated net revenues during 2012. These sales were primarily within the U.S. and Canada segment.
Hasbro purchases certain components used in its manufacturing process and certain finished products from
manufacturers in the Far East. The Company’s reliance on external sources of manufacturing can be shifted, over
a period of time, to alternative sources of supply for products it sells, should such changes be necessary.
However, if the Company were prevented from obtaining products from a substantial number of its current Far
East suppliers due to political, labor or other factors beyond its control, the Company’s operations would be
disrupted, potentially for a significant period of time, while alternative sources of product were secured. The
imposition of trade sanctions, quotas or other protectionist measures by the United States or the European Union
against a class of products imported by Hasbro from, or the loss of “normal trade relations” status with, China
could significantly increase the cost of the Company’s products imported into the United States or Europe.
The Company has agreements which allow it to develop and market products based on properties owned by
third parties including its license with Marvel Entertainment, LLC and Marvel Characters B.V. (together
“Marvel”) and its license with Lucas Licensing Ltd. and Lucasfilm Ltd. (together “Lucas”). These licenses have
multi-year terms and provide the Company with the right to market and sell designated classes of products based
on Marvel’s portfolio of brands, including SPIDER-MAN and THE AVENGERS, and Lucas’s STAR WARS
brand. Hasbro’s net revenues from these licenses can be significant in any given year based on the level of third
party entertainment. Both Marvel and Lucas are owned by The Walt Disney Company.
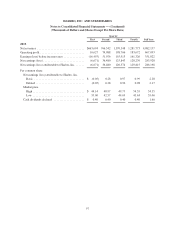
(19) Quarterly Financial Data (Unaudited)
Quarter
First Second Third Fourth Full Year
2014
Net revenues ................................ $679,453 829,262 1,469,899 1,298,593 4,277,207
Operating profit .............................. 43,448 82,564 285,814 223,549 635,375
Earnings (loss) before income taxes .............. 25,995 64,517 244,054 205,422 539,988
Net earnings (loss) ............................ 31,514 32,820 180,155 168,821 413,310
Net earnings (loss) attributable to Hasbro, Inc. ...... 32,087 33,475 180,457 169,911 415,930
Per common share
Net earnings (loss) attributable to Hasbro, Inc.
Basic .................................. $ 0.24 0.26 1.42 1.35 3.24
Diluted ................................. 0.24 0.26 1.40 1.34 3.20
Market price
High ................................... $ 55.67 56.91 55.78 59.42 59.42
Low ................................... 47.48 51.08 48.01 52.74 47.48
Cash dividends declared ..................... $ 0.43 0.43 0.43 0.43 1.72
96


