Hasbro 2014 Annual Report Download - page 48
Download and view the complete annual report
Please find page 48 of the 2014 Hasbro annual report below. You can navigate through the pages in the report by either clicking on the pages listed below, or by using the keyword search tool below to find specific information within the annual report.-
 1
1 -
2
-
3
-
4
-
5
-
6
-
7
-
8
-
9
-
10
-
11
-
12
-
13
-
14
-
15
-
16
-
17
-
18
-
19
-
20
-
21
-
22
-
23
-
24
-
25
-
26
-
27
-
28
-
29
-
30
-
31
-
32
-
33
-
34
-
35
-
36
-
37
-
 38
38 -
 39
39 -
 40
40 -
 41
41 -
 42
42 -
 43
43 -
 44
44 -
 45
45 -
 46
46 -
 47
47 -
 48
48 -
 49
49 -
 50
50 -
 51
51 -
 52
52 -
 53
53 -
 54
54 -
 55
55 -
 56
56 -
 57
57 -
 58
58 -
59
-
60
-
61
-
62
-
63
-
64
-
65
-
66
-
67
-
68
-
69
-
70
-
71
-
72
-
73
-
74
-
75
-
76
-
77
-
78
-
79
-
80
-
81
-
82
-
83
-
84
-
85
-
86
-
87
-
88
-
89
-
90
-
91
-
92
-
93
-
94
-
95
-
96
-
97
-
98
-
99
-
100
-
101
-
102
-
103
-
104
-
105
-
106
-
107
-
108
-
109
-
110
-
111
-
112
-
113
-
114
-
115
-
116
-
117
-
118
-
119
-
120
-
121
-
122
-
123
-
124
-
125
-
126
-
127
 |
 |

line for $58,040. For the year ended December 29, 2013, the Company recognized a charge, net of tax, related to
the settlement of this arbitration award totaling $53,053, or $0.40 per diluted share.
Net earnings for 2013 also included restructuring and related pension charges, net of tax, of $30,877, or
$0.23 per diluted share, related to the multi-year cost savings initiative announced during the fourth quarter of
2012 as well as product-related charges, net of tax, of $25,895, or $0.20 per diluted share, related to the exit from
certain non-strategic brands. Net earnings for 2013 were also positively impacted by a favorable tax benefit of
$23,637, or $0.18 per diluted share, related to the settlement of certain tax exams in the United States.
Net earnings for 2012 included an unfavorable impact of $32,762, or $0.26 per diluted share, resulting from
restructuring charges related to cost savings initiatives announced during the first and fourth quarters of 2012.
In July 2013 the Company acquired a 70% majority interest in Backflip. The Company is consolidating the
financial results of Backflip in its consolidated financial statements and, accordingly, reported revenues, costs
and expenses, assets and liabilities, and cash flows include 100% of Backflip, with the 30% noncontrolling
interests share reported as net loss attributable to noncontrolling interests in the consolidated statements of
operations and redeemable noncontrolling interests on the consolidated balance sheets. The results of operations
for the year ended December 28, 2014 include a full year of Backflip operations whereas the results of operations
for the year ended December 29, 2013 included the operations of Backflip from the acquisition closing date of
July 8, 2013. The results of Backflip are reported in the Entertainment and Licensing segment.
Consolidated net revenues for the year ended December 28, 2014 grew to $4,277,207 compared to
$4,082,157 in 2013 and $4,088,983 in 2012. Most of the Company’s net revenues and operating profits were
derived from its three principal segments: the U.S. and Canada segment, the International segment and the
Entertainment and Licensing segment, which are discussed in detail below. Consolidated net revenues in 2014
and 2013 were impacted by favorable/(unfavorable) foreign currency translation of approximately $(93,400) and
$3,700, respectively. Absent the impact of foreign currency translation, 2014 net revenues grew approximately
7% compared to 2013. The Company’s focus on franchise brands contributed to overall growth of consolidated
net revenues, with franchise brands revenues growing approximately 31% in 2014 compared to 2013 and 15% in
2013 compared to 2012. In 2014 and 2013, franchise brands comprised approximately 55% and 44% of
consolidated net revenues, respectively. Six of the seven franchise brands experienced growth during 2014,
including MAGIC: THE GATHERING, MONOPOLY, MY LITTLE PONY, NERF, PLAY-DOH and
TRANSFORMERS.
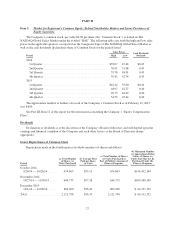
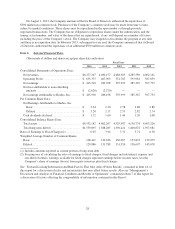
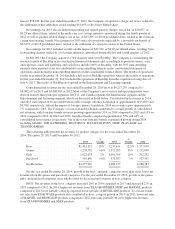
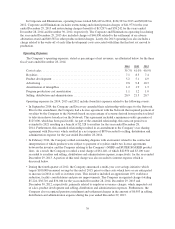
The following table presents net revenues by product category for the years ended December 28,
2014, December 29, 2013 and December 30, 2012.
2014
%
Change 2013
%
Change 2012
Boys ............................ $1,483,952 20% 1,237,611 (22)% 1,577,010
Games ........................... 1,259,782 (4)% 1,311,205 10% 1,192,090
Girls ............................ 1,022,633 2% 1,001,704 26% 792,292
Preschool ........................ 510,840 (4)% 531,637 1% 527,591
Net Revenues ..................... $4,277,207 4,082,157 4,088,983
For the year ended December 28, 2014, growth in the boys’ and girls’ categories more than offset lower net
revenues from the games and preschool categories. For the year ended December 29, 2013, growth in the games,
girls’ and preschool categories were wholly offset by decreased net revenues in boys category.
BOYS: Net revenues in the boys’ category increased 20% in 2014 compared to 2013 and decreased 22% in
2013 compared to 2012. In 2014, higher net revenues from TRANSFORMERS, NERF and MARVEL products
compared to 2013 were partially offset by expected lower net sales of BEYBLADE products. To a lesser extent,
net sales from STAR WARS products also contributed to boys’ category growth in 2014. In 2013, lower net sales
of MARVEL and BEYBLADE products compared to 2012 were only partially offset by higher net revenues
from TRANSFORMERS and NERF products.
34