Hasbro 2014 Annual Report Download - page 70
Download and view the complete annual report
Please find page 70 of the 2014 Hasbro annual report below. You can navigate through the pages in the report by either clicking on the pages listed below, or by using the keyword search tool below to find specific information within the annual report.-
 1
1 -
2
-
3
-
4
-
5
-
6
-
7
-
8
-
9
-
10
-
11
-
12
-
13
-
14
-
15
-
16
-
17
-
18
-
19
-
20
-
21
-
22
-
23
-
24
-
25
-
26
-
27
-
28
-
29
-
30
-
31
-
32
-
33
-
34
-
35
-
36
-
37
-
38
-
39
-
40
-
41
-
42
-
43
-
44
-
45
-
46
-
47
-
48
-
49
-
50
-
51
-
52
-
53
-
54
-
55
-
56
-
57
-
58
-
59
-
 60
60 -
 61
61 -
 62
62 -
 63
63 -
 64
64 -
 65
65 -
 66
66 -
 67
67 -
 68
68 -
 69
69 -
 70
70 -
 71
71 -
 72
72 -
 73
73 -
 74
74 -
 75
75 -
 76
76 -
 77
77 -
 78
78 -
 79
79 -
 80
80 -
81
-
82
-
83
-
84
-
85
-
86
-
87
-
88
-
89
-
90
-
91
-
92
-
93
-
94
-
95
-
96
-
97
-
98
-
99
-
100
-
101
-
102
-
103
-
104
-
105
-
106
-
107
-
108
-
109
-
110
-
111
-
112
-
113
-
114
-
115
-
116
-
117
-
118
-
119
-
120
-
121
-
122
-
123
-
124
-
125
-
126
-
127
 |
 |

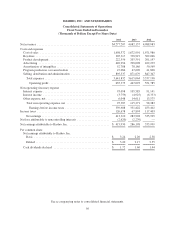
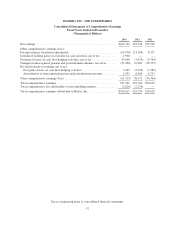
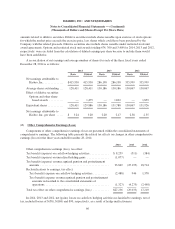
HASBRO, INC. AND SUBSIDIARIES
Consolidated Statements of Operations
Fiscal Years Ended in December
(Thousands of Dollars Except Per Share Data)
2014 2013 2012
Net revenues ................................................. $4,277,207 4,082,157 4,088,983
Costs and expenses
Cost of sales ............................................... 1,698,372 1,672,901 1,671,980
Royalties .................................................. 305,317 338,919 302,066
Product development ......................................... 222,556 207,591 201,197
Advertising ................................................ 420,256 398,098 422,239
Amortization of intangibles .................................... 52,708 78,186 50,569
Program production cost amortization ........................... 47,086 47,690 41,800
Selling, distribution and administration .......................... 895,537 871,679 847,347
Total expenses ............................................ 3,641,832 3,615,064 3,537,198
Operating profit ......................................... 635,375 467,093 551,785
Non-operating (income) expense
Interest expense ............................................. 93,098 105,585 91,141
Interest income ............................................. (3,759) (4,925) (6,333)
Other expense, net ........................................... 6,048 14,611 13,575
Total non-operating expense, net ............................. 95,387 115,271 98,383
Earnings before income taxes .............................. 539,988 351,822 453,402
Income taxes ................................................. 126,678 67,894 117,403
Net earnings .............................................. 413,310 283,928 335,999
Net loss attributable to noncontrolling interests ...................... (2,620) (2,270) —
Net earnings attributable to Hasbro, Inc. ........................... $ 415,930 286,198 335,999
Per common share
Net earnings attributable to Hasbro, Inc.
Basic ................................................... $ 3.24 2.20 2.58
Diluted .................................................. $ 3.20 2.17 2.55
Cash dividends declared ...................................... $ 1.72 1.60 1.44
See accompanying notes to consolidated financial statements.
56