Hasbro 2014 Annual Report Download - page 52
Download and view the complete annual report
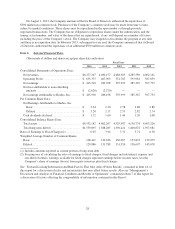
Please find page 52 of the 2014 Hasbro annual report below. You can navigate through the pages in the report by either clicking on the pages listed below, or by using the keyword search tool below to find specific information within the annual report.In the girls’ category, franchise brands MY LITTLE PONY, NERF and PLAY-DOH contributed to growth
in 2014 compared to 2013 that was only partially offset by lower net revenues from FURBY and LITTLEST PET
SHOP products. In 2013, the girls’ category grew compared to 2012 due to higher net revenues from MY
LITTLE PONY products as well as the introduction of NERF REBELLE products as well as FURBY products in
non-English speaking markets. This growth was partially offset by lower net revenues from LITTLEST PET
SHOP and FURREAL FRIENDS products. FURBY products were introduced in English-speaking markets in
2012 and globally in 2013.
In the preschool category, higher net revenues from franchise brands PLAY-DOH and TRANSFORMERS
in 2014 compared to 2013 were only partially offset by lower net revenues from core PLAYSKOOL products. In
2013, higher net revenues from PLAY-DOH and TRANSFORMERS products compared to 2012 were partially
offset by lower net revenues from TONKA and SESAME STREET products.
International segment operating profit increased 15% in 2014 compared to 2013 and 9% in 2013 compared
to 2012. Operating profit for the International segment was impacted by approximately $(18,800) and $4,700 in
2014 and 2013, respectively, due to the (unfavorable)/favorable foreign currency translation. Furthermore, 2014
and 2012 segment operating profit includes $6,079 and $1,628, respectively, of restructuring charges. Operating
profit margin increased to 13.4% of segment net revenues in 2014 from 12.6% of segment net revenues in 2013
and 12.1% of segment net revenues in 2012. The increase in operating profit in both 2014 and 2013 is the result
of higher net revenues and favorable product mix, partially offset by higher expense levels. The improvement in
operating profit margin in both 2014 and 2013 is primarily due to both revenue volume and mix, along with
better expense leverage from higher net revenues.
Entertainment and Licensing
Entertainment and Licensing segment net revenues increased 15% in 2014 compared to 2013 and 5% in
2013 compared to 2012. Increased net revenues in 2014 compared to 2013 were primarily related to higher net
revenues from lifestyle licensing, along with contributions from digital gaming and a full year of net revenues
from Backflip, of which a 70% interest was acquired during the third quarter of 2013. Partially offsetting these
increases were lower net revenues related to Entertainment. Higher lifestyle licensing net revenues included
growth in TRANSFORMERS and MY LITTLE PONY. Higher net revenues in 2013 compared to 2012 included
higher lifestyle licensing and digital gaming revenues, a partial year of revenues from Backflip, and lower
entertainment net revenues. Entertainment net revenues were impacted from a higher level of 2012 net revenues
related to digital distributions, which included the initial distribution of Hasbro Studios television programming
libraries to Netflix.
Entertainment and Licensing segment operating profit increased 33% in 2014 to $60,550 compared to
$45,476 in 2013 and $53,191 in 2012. The increase in operating profit in 2014 compared to 2013 is primarily due
to the profit impact from higher net revenues from lifestyle licensing, partially offset by the profit impact from
lower entertainment revenues. The decrease in operating profit in 2013 compared to 2012 is primarily due to
losses from Entertainment and Backflip that were partially offset by the favorable profit impact from higher
licensing and digital gaming net revenues. Backflip operating losses approximated $8,700 and $7,600 in 2014
and 2013, respectively, and were primarily due to amortization of acquired intangibles. Operating profit for both
2013 and 2012 include restructuring charges of $1,729 and $555, respectively.
Other Segments and Corporate and Eliminations
In the Global Operations segment, operating profit of $15,767 in 2014 compared to $6,712 in 2013 and
operating losses of $15,964 in 2012. The operating loss in 2012 included severance costs of $4,307 associated
with restructuring activities. The improvement in operating results in the Global Operations segment is primarily
due to improvements made in owned manufacturing facilities and expense reductions associated with
restructuring activities.
38


