Hasbro 2014 Annual Report Download - page 47
Download and view the complete annual report
Please find page 47 of the 2014 Hasbro annual report below. You can navigate through the pages in the report by either clicking on the pages listed below, or by using the keyword search tool below to find specific information within the annual report.-
 1
1 -
2
-
3
-
4
-
5
-
6
-
7
-
8
-
9
-
10
-
11
-
12
-
13
-
14
-
15
-
16
-
17
-
18
-
19
-
20
-
21
-
22
-
23
-
24
-
25
-
26
-
27
-
28
-
29
-
30
-
31
-
32
-
33
-
34
-
35
-
36
-
 37
37 -
 38
38 -
 39
39 -
 40
40 -
 41
41 -
 42
42 -
 43
43 -
 44
44 -
 45
45 -
 46
46 -
 47
47 -
 48
48 -
 49
49 -
 50
50 -
 51
51 -
 52
52 -
 53
53 -
 54
54 -
 55
55 -
 56
56 -
 57
57 -
58
-
59
-
60
-
61
-
62
-
63
-
64
-
65
-
66
-
67
-
68
-
69
-
70
-
71
-
72
-
73
-
74
-
75
-
76
-
77
-
78
-
79
-
80
-
81
-
82
-
83
-
84
-
85
-
86
-
87
-
88
-
89
-
90
-
91
-
92
-
93
-
94
-
95
-
96
-
97
-
98
-
99
-
100
-
101
-
102
-
103
-
104
-
105
-
106
-
107
-
108
-
109
-
110
-
111
-
112
-
113
-
114
-
115
-
116
-
117
-
118
-
119
-
120
-
121
-
122
-
123
-
124
-
125
-
126
-
127
 |
 |

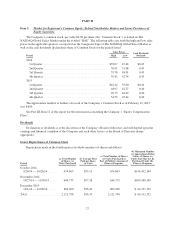
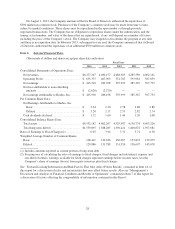
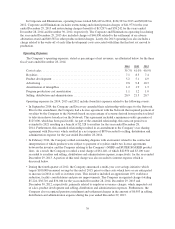
Summary
The components of the results of operations, stated as a percent of net revenues, are illustrated below for the
three fiscal years ended December 28, 2014.
2014 2013 2012
Net revenues .................................................. 100.0% 100.0% 100.0%
Costs and expenses:
Cost of sales ................................................ 39.7 41.0 40.9
Royalties ................................................... 7.1 8.3 7.4
Product development ......................................... 5.2 5.1 4.9
Advertising ................................................. 9.8 9.8 10.3
Amortization of intangibles .................................... 1.2 1.9 1.3
Program production cost amortization ............................ 1.1 1.2 1.0
Selling, distribution and administration ........................... 20.9 21.3 20.7
Operating profit ............................................... 14.9 11.4 13.5
Interest expense ............................................. 2.2 2.6 2.2
Interest income .............................................. (0.1) (0.1) (0.1)
Other expense, net ........................................... 0.2 0.3 0.3
Earnings before income taxes .................................... 12.6 8.6 11.1
Income taxes .................................................. 3.0 1.6 2.9
Net earnings .................................................. 9.7 7.0 8.2
Net loss attributable to noncontrolling interests ....................... (0.1) — —
Net earnings attributable to Hasbro, Inc. ............................ 9.7% 7.0% 8.2%
Results of Operations
The fiscal years ended December 28, 2014 and December 29, 2013 were each fifty-two week periods while
the fiscal year ended December 30, 2012 was a fifty-three week period.
Net earnings, including the impact of noncontrolling interests in Backflip, for the fiscal years ended
December 28, 2014 and December 29, 2013 were $413,310 and $283,928, respectively. Net earnings attributable
to Hasbro, Inc. for the fiscal year ended December 28, 2014 was $415,930, or $3.20 per diluted share, compared
to $286,198, or $2.17 per diluted share, and $335,999, or $2.55 per diluted share, in fiscal 2013 and 2012,
respectively. Net earnings and diluted earnings per share for each fiscal year in the three years ended
December 28, 2014 include certain charges and benefits as described below.
Net earnings for the year ended December 28, 2014 included charges, net of tax of $18,072, or $0.14 per
diluted share, related to the restructuring of the Company’s equity investment in its joint venture television
network with Discovery. The Company also had charges from other restructuring activities, net of tax, of $5,156,
or $0.04 per diluted share. The Company’s results also include a gain on the sale of intellectual property license
rights, net of tax, of $23,892, or $0.18 per diluted share, and a net favorable tax benefit of $6,570, or $0.05 per
diluted share, related to the settlement of certain tax examinations.
During 2013, the Company was involved in a dispute with an inventor related to the contractual
interpretation of which products are subject to payment of royalties under a license agreement between the
inventor and the Company which was adjudicated in binding arbitration. The arbitrator ultimately issued a ruling
which awarded $70,046, including damages, interest, fees and expenses to the inventor. In February 2014, the
Company and the inventor settled claims arising from or relating to this license agreement related to the NERF
product line and a license agreement between the parties relating to the Company’s SUPER SOAKER product
33