Hasbro 2014 Annual Report Download - page 109
Download and view the complete annual report
Please find page 109 of the 2014 Hasbro annual report below. You can navigate through the pages in the report by either clicking on the pages listed below, or by using the keyword search tool below to find specific information within the annual report.-
 1
1 -
2
-
3
-
4
-
5
-
6
-
7
-
8
-
9
-
10
-
11
-
12
-
13
-
14
-
15
-
16
-
17
-
18
-
19
-
20
-
21
-
22
-
23
-
24
-
25
-
26
-
27
-
28
-
29
-
30
-
31
-
32
-
33
-
34
-
35
-
36
-
37
-
38
-
39
-
40
-
41
-
42
-
43
-
44
-
45
-
46
-
47
-
48
-
49
-
50
-
51
-
52
-
53
-
54
-
55
-
56
-
57
-
58
-
59
-
60
-
61
-
62
-
63
-
64
-
65
-
66
-
67
-
68
-
69
-
70
-
71
-
72
-
73
-
74
-
75
-
76
-
77
-
78
-
79
-
80
-
81
-
82
-
83
-
84
-
85
-
86
-
87
-
88
-
89
-
90
-
91
-
92
-
93
-
94
-
95
-
96
-
97
-
98
-
 99
99 -
 100
100 -
 101
101 -
 102
102 -
 103
103 -
 104
104 -
 105
105 -
 106
106 -
 107
107 -
 108
108 -
 109
109 -
 110
110 -
 111
111 -
 112
112 -
 113
113 -
 114
114 -
 115
115 -
 116
116 -
 117
117 -
 118
118 -
 119
119 -
120
-
121
-
122
-
123
-
124
-
125
-
126
-
127
 |
 |

HASBRO, INC. AND SUBSIDIARIES
Notes to Consolidated Financial Statements — (Continued)
(Thousands of Dollars and Shares Except Per Share Data)
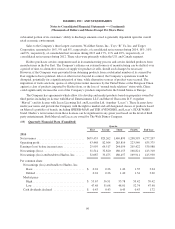
2013, certain inter-company balances were settled between each of the U.S. and Canada segment,
Entertainment and Licensing segment and Corporate and eliminations. This reduced the amount of reported
total assets of the U.S. and Canada and Entertainment and Licensing segments and increased the amount
reported in Corporate and eliminations at year-end 2013 compared to year-end 2012.
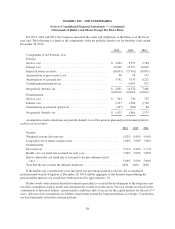
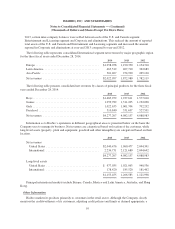
The following table represents consolidated International segment net revenues by major geographic region
for the three fiscal years ended December 28, 2014.
2014 2013 2012
Europe ........................................... $1,258,078 1,190,350 1,154,310
Latin America ..................................... 463,512 407,710 362,689
Asia Pacific ....................................... 301,407 274,920 265,120
Net revenues ...................................... $2,022,997 1,872,980 1,782,119
The following table presents consolidated net revenues by classes of principal products for the three fiscal
years ended December 28, 2014.
2014 2013 2012
Boys ............................................. $1,483,952 1,237,611 1,577,010
Games ........................................... 1,259,782 1,311,205 1,192,090
Girls ............................................. 1,022,633 1,001,704 792,292
Preschool ......................................... 510,840 531,637 527,591
Net revenues ...................................... $4,277,207 4,082,157 4,088,983
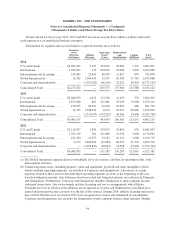
Information as to Hasbro’s operations in different geographical areas is presented below on the basis the
Company uses to manage its business. Net revenues are categorized based on location of the customer, while
long-lived assets (property, plant and equipment, goodwill and other intangibles) are categorized based on their
location.
2014 2013 2012
Net revenues
United States .................................... $2,040,476 1,960,477 2,044,341
International .................................... 2,236,731 2,121,680 2,044,642
$4,277,207 4,082,157 4,088,983
Long-lived assets
United States .................................... $ 977,035 1,021,063 940,536
International .................................... 178,420 185,520 181,462
$1,155,455 1,206,583 1,121,998
Principal international markets include Europe, Canada, Mexico and Latin America, Australia, and Hong
Kong.
Other Information
Hasbro markets its products primarily to customers in the retail sector. Although the Company closely
monitors the creditworthiness of its customers, adjusting credit policies and limits as deemed appropriate, a
95