Hasbro 2014 Annual Report Download - page 56
Download and view the complete annual report
Please find page 56 of the 2014 Hasbro annual report below. You can navigate through the pages in the report by either clicking on the pages listed below, or by using the keyword search tool below to find specific information within the annual report.
Other (Income) Expense, Net
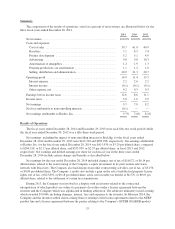
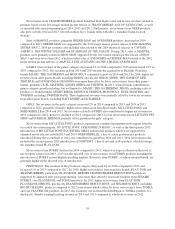
Other expense, net totaled $6,048 in 2014 compared to $14,611 in 2013 and $13,575 in 2012. Other
expense, net in 2014 includes a net loss of $29,784 related to the restructuring of the Company’s television
network joint venture. This net loss primarily consists of costs associated with an option agreement entered into
between the Company and Discovery and the Company’s share of restructuring costs recorded by the Network,
partially offset by a gain resulting from the reduction of amounts due to Discovery under a tax sharing
agreement. Other expense, net in 2014 also includes gains of $36,000 related to the sale of certain intellectual
property license rights and $3,400 related to the sale of an internet domain name. Excluding these items, other
expense, net in 2014 would have increased to $15,664 in 2014 compared to $14,611 in 2013, primarily due to
higher foreign exchange losses, partially offset by improved results from the Company’s share of the Network.
The increase in expense in 2013 compared to 2012 was primarily due to higher net losses on foreign currency
transactions and the impact of investment gains and losses.
Foreign currency exchange net losses of $20,879 in 2014 compared to $5,159 in 2013 and $4,178 in 2012.
The higher costs in 2014 resulted from the strengthening of the U.S. dollar against most of the Company’s
significant foreign currencies during the fourth quarter of 2014. Excluding the net loss associated with the 2014
restructuring, the Company’s share of (earnings) loss of the Network improved to a profit of $(7,840) in 2014
compared to a loss of $2,386 in 2013 and $6,015 in 2012.
Income Taxes
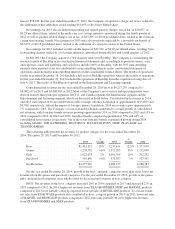
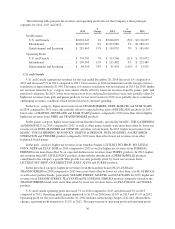
Income tax expense totaled 23.5% of pretax earnings in 2014 compared with 19.3% in 2013 and 25.9% in
2012. Income tax expense for 2014 includes net benefits of approximately $20,000 from discrete events,
primarily related to the effective settlement of certain open tax years in the United States and settlement of tax
examinations in certain jurisdictions including Mexico. Income tax expense for 2013 includes net benefits of
approximately $30,000 from discrete tax events, primarily related to the settlement of various tax examinations
in multiple jurisdictions, including the United States. Income tax expense for 2012 includes net benefits of
approximately $8,300 from discrete tax events, primarily related to the repatriation of certain highly taxed
foreign earnings and to expirations of statutes of limitations in multiple jurisdictions. Absent these items,
potential interest and penalties related to uncertain tax positions recorded in 2014, 2013 and 2012, and the impact
of the 2013 charges related to restructuring activities, exit from certain product lines and settlement of the
unfavorable arbitration award, the effective tax rates would have been 26.5%, 25.8% and 27.0%, respectively.
The decrease in the adjusted tax rate from 2012 to 2013 and increase from 2013 to 2014 primarily reflect the
change in the geographic mix of where the company earned its profits.
Other Information
In May 2014, the Financial Accounting Standards Board (“FASB”), in cooperation with the International
Accounting Standards Board (“IASB”), issued ASU No. 2014-09, Revenue from Contracts with Customers (ASC
606). This ASU supersedes the revenue recognition requirements in Accounting Standards Codification 605 —
Revenue Recognition and most industry-specific guidance throughout the Codification. This new guidance
provides a five-step model for analyzing contracts and transactions to determine when, how and if revenue is
recognized. Revenue should be recognized to depict the transfer of promised goods or services to customers in an
amount that reflects the consideration to which the company expects to be entitled in exchange for those goods or
services. This ASU is effective for fiscal years beginning after December 15, 2016, and for interim periods
within those fiscal years. The Company is evaluating the requirements of ASU 2014-09 and its potential impact
on the Company’s financial statements.
Liquidity and Capital Resources
The Company has historically generated a significant amount of cash from operations. In 2014 the Company
funded its operations and liquidity needs primarily through cash flows from operations, and, when needed, using
borrowings under its available lines of credit and its commercial paper program. During 2015, the Company
expects to continue to fund its working capital needs primarily through cash flows from operations and, when
42


