HSBC 2014 Annual Report Download - page 91
Download and view the complete annual report
Please find page 91 of the 2014 HSBC annual report below. You can navigate through the pages in the report by either clicking on the pages listed below, or by using the keyword search tool below to find specific information within the annual report.-
 1
1 -
2
-
3
-
4
-
5
-
6
-
7
-
8
-
9
-
10
-
11
-
12
-
13
-
14
-
15
-
16
-
17
-
18
-
19
-
20
-
21
-
22
-
23
-
24
-
25
-
26
-
27
-
28
-
29
-
30
-
31
-
32
-
33
-
34
-
35
-
36
-
37
-
38
-
39
-
40
-
41
-
42
-
43
-
44
-
45
-
46
-
47
-
48
-
49
-
50
-
51
-
52
-
53
-
54
-
55
-
56
-
57
-
58
-
59
-
60
-
61
-
62
-
63
-
64
-
65
-
66
-
67
-
68
-
69
-
70
-
71
-
72
-
73
-
74
-
75
-
76
-
77
-
78
-
79
-
80
-
 81
81 -
 82
82 -
 83
83 -
 84
84 -
 85
85 -
 86
86 -
 87
87 -
 88
88 -
 89
89 -
 90
90 -
 91
91 -
 92
92 -
 93
93 -
 94
94 -
 95
95 -
 96
96 -
 97
97 -
 98
98 -
 99
99 -
 100
100 -
 101
101 -
102
-
103
-
104
-
105
-
106
-
107
-
108
-
109
-
110
-
111
-
112
-
113
-
114
-
115
-
116
-
117
-
118
-
119
-
120
-
121
-
122
-
123
-
124
-
125
-
126
-
127
-
128
-
129
-
130
-
131
-
132
-
133
-
134
-
135
-
136
-
137
-
138
-
139
-
140
-
141
-
142
-
143
-
144
-
145
-
146
-
147
-
148
-
149
-
150
-
151
-
152
-
153
-
154
-
155
-
156
-
157
-
158
-
159
-
160
-
161
-
162
-
163
-
164
-
165
-
166
-
167
-
168
-
169
-
170
-
171
-
172
-
173
-
174
-
175
-
176
-
177
-
178
-
179
-
180
-
181
-
182
-
183
-
184
-
185
-
186
-
187
-
188
-
189
-
190
-
191
-
192
-
193
-
194
-
195
-
196
-
197
-
198
-
199
-
200
 |
 |

HSBC BANK PLC
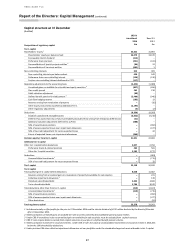
Report of the Directors: Capital Management (continued)
89
subsidiary bank, the ratio of structural exposures in a
given currency to risk-weighted assets denominated in
that currency is broadly equal to the capital ratio of the
subsidiary in question. We hedge structural foreign
exchange exposures only in limited circumstances.
2. Acquisitions and disposals
This is the movement in RWAs as a result of the disposal
or acquisition of business operations. This can be whole
businesses or parts of a business. The movement in
RWAs is quantified based on the credit risk exposures as
at the end of the month preceding a disposal or
following an acquisition.
3. Model updates
New/updated models
RWA movements arising from the implementation of
new models and from changes to existing parameter
models are allocated to this driver. This figure will also
include changes which arise following review of
modelling assumptions. Where a model recalibration
reflects an update to more recent performance data, the
resulting RWA changes are not assigned here, but
instead reported under book quality.
RWA changes are estimated based on the impact
assessments made in the testing phase prior to
implementation. These values are used to simulate the
effect of new or updated models on the portfolio at the
point of implementation, assuming there were no major
changes in the portfolio from the testing phase to
implementation phase.
Portfolios moving onto IRB approach
Where a portfolio moves from the standardised
approach to the IRB approach, the RWA movement by
key driver statement shows the increase in IRB RWAs,
but does not show the corresponding reduction in
standardised approach RWAs as its scope is limited to
IRB only.
The movement in RWAs is quantified at the date at
which the IRB approach is applied, and not during the
testing phase as with a new/updated model.
4. Methodology and policy
Internal regulatory updates
This captures the effect on RWAs of changing the
internal treatment of exposures. This may include, but is
not limited to, a portfolio or a part of one moving from
an existing IRB model onto a standardised model,
identification of netting and credit risk mitigation.
External regulatory updates
This specifies the effect of additional or changing
regulatory requirements. This includes, but is not limited
to, regulatory-prescribed changes to the RWA
calculation. The movement in RWAs is quantified by
comparing the RWAs calculated for that portfolio under
the old and the new requirements.
5. Book size
RWA movements attributed to this driver are those we
would expect to experience for the given movement in
exposure, as measured by EAD, assuming a stable risk
profile. These RWA movements arise in the normal
course of business, such as growth in credit exposures or
reduction in book size from run-offs and write-offs.
The RWA movement is quantified as follows:
• RWA and EAD changes captured in the four drivers
above are excluded from the total movements to
create an adjusted movement in EAD and RWA for
the period.
• The average RWA to EAD percentage is calculated for
the adjusted position and is applied to the adjusted
movement in EAD.
As the calculation relies on averaging, the output is
dependent upon the degree of portfolio aggregation and
the number of discrete time periods for which the
calculation is undertaken. For each quarter of 2014 this
calculation was performed for each HSBC company with
an IRB portfolio by global businesses, split by the main
Basel categories of credit exposures, as described in the
table below:
The total of the results is shown in book size within the
RWA movement by key driver table.
6. Book quality
This represents RWA movements resulting from changes
in the underlying credit quality of customers. These are
caused by changes to IRB risk parameters which arise
from actions such as, but not limited to, model
recalibration, change in counterparty external rating, or
the influence of new lending on the average quality of
the book. The change in RWAs attributable to book
quality is calculated as the balance of RWA movements
after taking account of all drivers described above.
The RWA movement by key driver statement includes
only movements which are calculated under the IRB
approach. Certain classes of credit risk exposure are
treated as capital deductions and therefore reductions
are not shown in this statement. If the treatment of a
credit risk exposure changes from RWA to capital
deduction in the period, then only the reduction in RWAs
would appear in the RWA movement by key driver
tables. In this instance, a reduction in RWAs does not
necessarily indicate an improvement in the capital
position.