HSBC 2014 Annual Report Download - page 90
Download and view the complete annual report
Please find page 90 of the 2014 HSBC annual report below. You can navigate through the pages in the report by either clicking on the pages listed below, or by using the keyword search tool below to find specific information within the annual report.-
 1
1 -
2
-
3
-
4
-
5
-
6
-
7
-
8
-
9
-
10
-
11
-
12
-
13
-
14
-
15
-
16
-
17
-
18
-
19
-
20
-
21
-
22
-
23
-
24
-
25
-
26
-
27
-
28
-
29
-
30
-
31
-
32
-
33
-
34
-
35
-
36
-
37
-
38
-
39
-
40
-
41
-
42
-
43
-
44
-
45
-
46
-
47
-
48
-
49
-
50
-
51
-
52
-
53
-
54
-
55
-
56
-
57
-
58
-
59
-
60
-
61
-
62
-
63
-
64
-
65
-
66
-
67
-
68
-
69
-
70
-
71
-
72
-
73
-
74
-
75
-
76
-
77
-
78
-
79
-
 80
80 -
 81
81 -
 82
82 -
 83
83 -
 84
84 -
 85
85 -
 86
86 -
 87
87 -
 88
88 -
 89
89 -
 90
90 -
 91
91 -
 92
92 -
 93
93 -
 94
94 -
 95
95 -
 96
96 -
 97
97 -
 98
98 -
 99
99 -
 100
100 -
101
-
102
-
103
-
104
-
105
-
106
-
107
-
108
-
109
-
110
-
111
-
112
-
113
-
114
-
115
-
116
-
117
-
118
-
119
-
120
-
121
-
122
-
123
-
124
-
125
-
126
-
127
-
128
-
129
-
130
-
131
-
132
-
133
-
134
-
135
-
136
-
137
-
138
-
139
-
140
-
141
-
142
-
143
-
144
-
145
-
146
-
147
-
148
-
149
-
150
-
151
-
152
-
153
-
154
-
155
-
156
-
157
-
158
-
159
-
160
-
161
-
162
-
163
-
164
-
165
-
166
-
167
-
168
-
169
-
170
-
171
-
172
-
173
-
174
-
175
-
176
-
177
-
178
-
179
-
180
-
181
-
182
-
183
-
184
-
185
-
186
-
187
-
188
-
189
-
190
-
191
-
192
-
193
-
194
-
195
-
196
-
197
-
198
-
199
-
200
 |
 |

HSBC BANK PLC
Report of the Directors: Capital Management (continued)
88
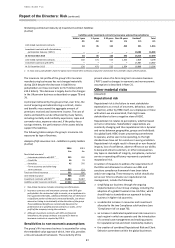
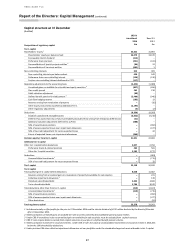
Reconciliation of regulatory capital from CRD IV transitional basis to an estimated CRD IV end point basis
(Unaudited)
At 31 Dec 2014
£m
Common equity tier 1 capital on a transitional basis
21,091
Unrealised gains in available for sale reserves
837
Common equity tier 1 capital end point basis
21,928
Additional tier 1 capital on a transitional basis
4,047
Grandfathered instruments:
Preference share premium
(345)
Other tier 1 capital securities
(1,507)
Additional tier 1 capital end point basis
2,195
Tier 1 capital end point basis
24,123
Tier 2 capital on a transitional basis
8,418
Grandfathered instruments:
Term subordinated debt
(2,326)
Tier 2 capital end point basis
6,092
Total regulatory capital end point basis
30,215
Risk Weighted Assets (‘RWAs’)
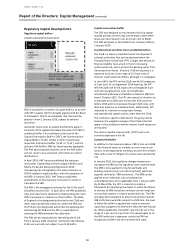
RWA movement by business by key driver – non-counterparty credit risk – IRB only
(Unaudited)
RBWM
CMB
GB&M
GPB
Other
Total
£bn
£bn
£bn
£bn
£bn
£bn
RWAs at 1 January 2014 on
Basel 2.5 basis
14.6
38.7
42.7
3.3
0.9
100.2
Foreign exchange movement
(0.1)
(0.6)
0.9
–
–
0.2
Acquisitions and disposals
–
–
(0.1)
–
(0.2)
(0.3)
Book size
0.6
4.2
(1.8)
(0.6)
(0.2)
2.2
Book quality
(1.4)
0.7
(1.9)
(0.2)
0.4
(2.4)
Model new/updated
(0.1)
–
–
–
–
(0.1)
Methodology and policy
0.7
6.0
29.4
0.2
1.1
37.4
– external updates – regulatory
–
7.6
5.2
0.2
–
13.0
– CRD IV impact
(0.6)
(1.9)
23.6
–
0.1
21.2
– NCOA moving from STD to IRB
1.3
0.3
0.6
–
1.0
3.2
Total RWA movement
(0.3)
10.3
26.5
(0.6)
1.1
37.0
RWAs at 31 December 2014 on
CRD IV basis
14.3
49.0
69.2
2.7
2.0
137.2
Methodology and policy changes – capital and RWA
Methodology and policy updates mainly related to the
implementation of the CRD IV rules at 1 January 2014,
and increased RWAs by approximately £37 billion. The
main movement arose from non-investment grade
securitisation positions which were previously deducted
from capital. These are now included in RWAs with a
1,250 per cent risk weight, causing a rise of £22.5 billion.
Further increases in capital requirements stem from
other changes such as the need to hold capital against
credit valuation adjustment of £9.2 billion, the risk of
failure of central counterparties of £2 billion and the
£4.9 billion increase in RWAs caused by the asset value
correlation multiplier applied to exposures to large or
unregulated counterparties in the financial sector.
The change in treatment of non-investment grade
securitisation positions was also responsible for an
increase in capital of £1.8 billion. This was offset by other
CRD IV changes, notably the £1.1 billion impact of a
progressive cap on grandfathered capital instruments
and a £0.9 billion deduction for a prudential valuation
adjustment.
In addition, with effect from 31 March 2014, a 45 per
cent loss given default floor has applied to bank
exposures and UK corporate portfolios which did not
fully meet modelling requirements, resulting in an
increase of RWAs of £12.9 billion.
RWAs by key driver – basis of preparation
and supporting notes
Credit risk drivers – definitions and quantification
The causal analysis of RWA movements splits the total
movement in IRB RWAs into six drivers, described below.
The first four relate to specific, identifiable and
measurable changes. The remaining two, book size and
book quality, are derived after accounting for
movements in the first four specific drivers.
1. Foreign exchange movements
This is the movement in RWAs as a result of changes in
the exchange rate between the functional currency of
the HSBC company owning each portfolio and Sterling,
being our presentation currency for consolidated
reporting. Our structural foreign exchange exposures are
managed with the primary objective of ensuring, where
practical, that our consolidated capital ratios and the
capital ratios of individual banking subsidiaries are
largely protected from the effect of changes in exchange
rates. This is usually achieved by ensuring that, for each