HSBC 2014 Annual Report Download - page 25
Download and view the complete annual report
Please find page 25 of the 2014 HSBC annual report below. You can navigate through the pages in the report by either clicking on the pages listed below, or by using the keyword search tool below to find specific information within the annual report.-
 1
1 -
2
-
3
-
4
-
5
-
6
-
7
-
8
-
9
-
10
-
11
-
12
-
13
-
14
-
 15
15 -
 16
16 -
 17
17 -
 18
18 -
 19
19 -
 20
20 -
 21
21 -
 22
22 -
 23
23 -
 24
24 -
 25
25 -
 26
26 -
 27
27 -
 28
28 -
 29
29 -
 30
30 -
 31
31 -
 32
32 -
 33
33 -
 34
34 -
 35
35 -
36
-
37
-
38
-
39
-
40
-
41
-
42
-
43
-
44
-
45
-
46
-
47
-
48
-
49
-
50
-
51
-
52
-
53
-
54
-
55
-
56
-
57
-
58
-
59
-
60
-
61
-
62
-
63
-
64
-
65
-
66
-
67
-
68
-
69
-
70
-
71
-
72
-
73
-
74
-
75
-
76
-
77
-
78
-
79
-
80
-
81
-
82
-
83
-
84
-
85
-
86
-
87
-
88
-
89
-
90
-
91
-
92
-
93
-
94
-
95
-
96
-
97
-
98
-
99
-
100
-
101
-
102
-
103
-
104
-
105
-
106
-
107
-
108
-
109
-
110
-
111
-
112
-
113
-
114
-
115
-
116
-
117
-
118
-
119
-
120
-
121
-
122
-
123
-
124
-
125
-
126
-
127
-
128
-
129
-
130
-
131
-
132
-
133
-
134
-
135
-
136
-
137
-
138
-
139
-
140
-
141
-
142
-
143
-
144
-
145
-
146
-
147
-
148
-
149
-
150
-
151
-
152
-
153
-
154
-
155
-
156
-
157
-
158
-
159
-
160
-
161
-
162
-
163
-
164
-
165
-
166
-
167
-
168
-
169
-
170
-
171
-
172
-
173
-
174
-
175
-
176
-
177
-
178
-
179
-
180
-
181
-
182
-
183
-
184
-
185
-
186
-
187
-
188
-
189
-
190
-
191
-
192
-
193
-
194
-
195
-
196
-
197
-
198
-
199
-
200
 |
 |

HSBC BANK PLC
Strategic Report: Business Review (continued)
23
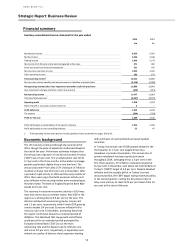
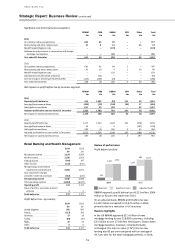
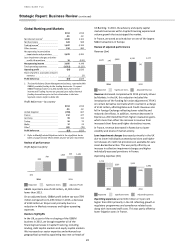
Global Private Banking
2014
2013
£m
£m
Net interest income
203
224
Net fee income
112
100
Trading income
11
10
Other income
(2)
(4)
Net operating income be
-fore
impairments and provisions
324
330
Loan impairment charges and other
credit risk provisions
4
(14)
Net operating income
328
316
Total operating expenses
(213)
(176)
Operating profit
115
140
Share of profit in associates and joint
ventures
–
–
Profit before tax
115
140
Profit before tax – by country
2014
2013
£m
£m
United Kingdom
100
99
France
-
13
Germany
16
28
Turkey
-
–
Malta
-
–
Other
(1)
–
Profit before tax
115
140
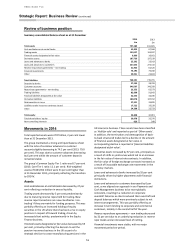
Review of performance
Profit before tax (£m)
GPB reported a profit before tax of £115 million,
£25 million or 18 per cent lower than 2013.
GPB adjusted profit before tax was £141 million
compared to £143 million in 2013, a decrease of £2
million.
Business highlights
GPB continued to reposition its business model and
target its client base by reviewing portfolios and ensuring
that all clients comply with Global Standards including
financial crime compliance and tax transparency
standards.
The business continued to focus on clients with wider
Group connectivity within the home and priority
markets, as well as reduce the number of clients in non-
priority markets.
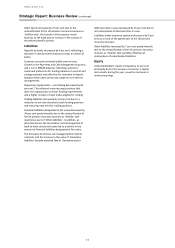
Review of adjusted performance
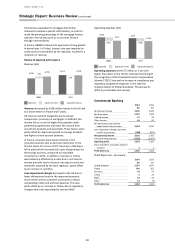
Revenue (£m)
Revenue in the UK increased primarily due to the
acquisition of Channel Islands entities from HSBC Private
Banking Holdings (Suisse) SA in December 2013.
In Germany, revenues declined reflecting the disposal of
an off-shore portfolio by HSBC Trinkaus & Burkhardt AG
in 2014.
Loan impairment charges decreased due to collective
impairment provision releases and lower individually
assessed provisions compared to charges in the UK in
2013.
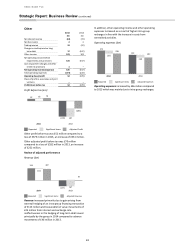
Operating expenses (£m)
Operating expenses increased by £40 million or 23 per
cent compared to 2013. The increase in the UK was
principally due to the acquisition of Channel Islands
entities from HSBC Private Banking Holdings (Suisse) SA
in December 2013. In addition, operating expenses
increased in France due to the non-recurrence of a
recovery of a litigation provision in 2013. This was partly
offset by lower expenses resulting from the disposal of
an off-shore portfolio by HSBC Trinkaus & Burkhardt AG,
Germany in 2014.
115
140
26 141 3143
2014
2013
Adjusted Profit
Reported
Significant items
324 330
26 350 330
2014
2013
Adjusted RevenueReported
Significant items
213
176
213
(3)
173
2014
2013
Adjusted ExpensesReported
Significant items