HSBC 2014 Annual Report Download - page 53
Download and view the complete annual report
Please find page 53 of the 2014 HSBC annual report below. You can navigate through the pages in the report by either clicking on the pages listed below, or by using the keyword search tool below to find specific information within the annual report.-
 1
1 -
2
-
3
-
4
-
5
-
6
-
7
-
8
-
9
-
10
-
11
-
12
-
13
-
14
-
15
-
16
-
17
-
18
-
19
-
20
-
21
-
22
-
23
-
24
-
25
-
26
-
27
-
28
-
29
-
30
-
31
-
32
-
33
-
34
-
35
-
36
-
37
-
38
-
39
-
40
-
41
-
42
-
 43
43 -
 44
44 -
 45
45 -
 46
46 -
 47
47 -
 48
48 -
 49
49 -
 50
50 -
 51
51 -
 52
52 -
 53
53 -
 54
54 -
 55
55 -
 56
56 -
 57
57 -
 58
58 -
 59
59 -
 60
60 -
 61
61 -
 62
62 -
 63
63 -
64
-
65
-
66
-
67
-
68
-
69
-
70
-
71
-
72
-
73
-
74
-
75
-
76
-
77
-
78
-
79
-
80
-
81
-
82
-
83
-
84
-
85
-
86
-
87
-
88
-
89
-
90
-
91
-
92
-
93
-
94
-
95
-
96
-
97
-
98
-
99
-
100
-
101
-
102
-
103
-
104
-
105
-
106
-
107
-
108
-
109
-
110
-
111
-
112
-
113
-
114
-
115
-
116
-
117
-
118
-
119
-
120
-
121
-
122
-
123
-
124
-
125
-
126
-
127
-
128
-
129
-
130
-
131
-
132
-
133
-
134
-
135
-
136
-
137
-
138
-
139
-
140
-
141
-
142
-
143
-
144
-
145
-
146
-
147
-
148
-
149
-
150
-
151
-
152
-
153
-
154
-
155
-
156
-
157
-
158
-
159
-
160
-
161
-
162
-
163
-
164
-
165
-
166
-
167
-
168
-
169
-
170
-
171
-
172
-
173
-
174
-
175
-
176
-
177
-
178
-
179
-
180
-
181
-
182
-
183
-
184
-
185
-
186
-
187
-
188
-
189
-
190
-
191
-
192
-
193
-
194
-
195
-
196
-
197
-
198
-
199
-
200
 |
 |

HSBC BANK PLC
Report of the Directors: Risk (continued)
51
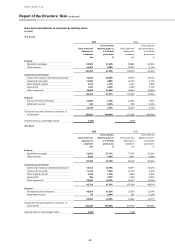
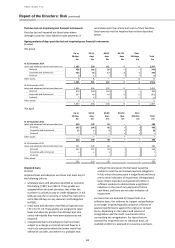
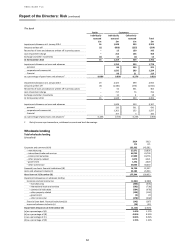
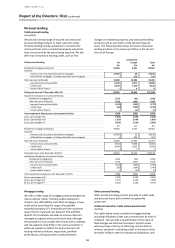
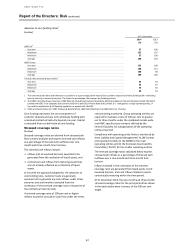
Impairment of loans and advances
(Audited)
The tables below analyses the loan impairment charges
for the year and the impairment allowances recognised
for impaired loans and advances that are either
individually assessed or collectively assessed, and
collective impairment allowances on loans and
advances classified as not impaired.
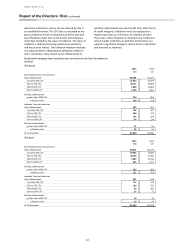
Loan impairment charge to the income statement by industry sector
(Unaudited)
2014
2013
£m
£m
Personal
148
215
– residential mortgages
(45)
(9)
– other personal
193
224
Corporate and commercial
472
921
– manufacturing and international trade and services
306
518
– commercial real estate and other property-related
50
276
– other commercial
116
127
Financial
27
(34)
Total loan impairment charge at 31 December
647
1,102
Individually assessed impairment allowances
363
859
– new allowances
656
1,148
– release of allowances no longer required
(288)
(257)
– recoveries of amounts previously written off
(5)
(32)
Collectively assessed impairment allowances
284
243
– new allowances net of allowance releases
460
617
– recoveries of amounts previously written off
(176)
(374)
Total loan impairment charge at 31 December
647
1,102
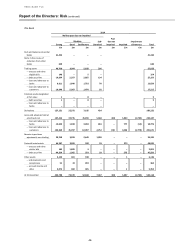
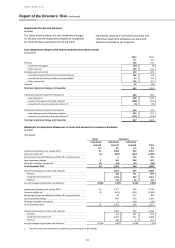
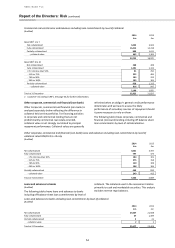
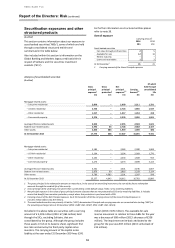
Movement in impairment allowances on loans and advances to customers and banks
(Audited)
The group
Banks
Customers
Individually
assessed
Individually
assessed
Collectively
assessed
Total
£m
£m
£m
£m
Impairment allowance at 1 January 2014
21
2,402
934
3,357
Amounts written off
(1)
(827)
(457)
(1,285)
Recoveries of loans and advances written off in previous years
–
5
176
181
Loan impairment charge
2
361
284
647
Exchange and other movements
(2)
(67)
(11)
(80)
At 31 December 2014
20
1,874
926
2,820
Impairment allowance on loans and advances
1,874
926
2,800
- personal
186
511
697
- corporate and commercial
1,572
389
1,961
- financial
116
26
142
as a percentage of gross loans and advances1
0.08%
0.72%
0.36%
0.99%
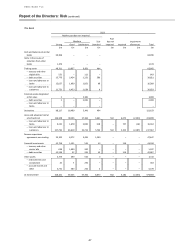
Impairment allowance at 1 January 2013
24
2,327
919
3,270
Amounts written off
(3)
(822)
(561)
(1,386)
Recoveries of loans and advances written off in previous years
–
32
374
406
Loan impairment charge
–
859
243
1,102
Exchange and other movements
–
6
(41)
(35)
At 31 December 2013
21
2,402
934
3,357
Impairment allowance on loans and advances
2,402
934
3,336
- personal
256
585
841
- corporate and commercial
1,947
341
2,288
- financial
199
8
207
as a percentage of gross loans and advances1
0.09%
0.87%
0.34%
1.12%
1 Net of reverse repo transactions, settlement accounts and stock borrowings.