HSBC 2014 Annual Report Download - page 71
Download and view the complete annual report
Please find page 71 of the 2014 HSBC annual report below. You can navigate through the pages in the report by either clicking on the pages listed below, or by using the keyword search tool below to find specific information within the annual report.-
 1
1 -
2
-
3
-
4
-
5
-
6
-
7
-
8
-
9
-
10
-
11
-
12
-
13
-
14
-
15
-
16
-
17
-
18
-
19
-
20
-
21
-
22
-
23
-
24
-
25
-
26
-
27
-
28
-
29
-
30
-
31
-
32
-
33
-
34
-
35
-
36
-
37
-
38
-
39
-
40
-
41
-
42
-
43
-
44
-
45
-
46
-
47
-
48
-
49
-
50
-
51
-
52
-
53
-
54
-
55
-
56
-
57
-
58
-
59
-
60
-
 61
61 -
 62
62 -
 63
63 -
 64
64 -
 65
65 -
 66
66 -
 67
67 -
 68
68 -
 69
69 -
 70
70 -
 71
71 -
 72
72 -
 73
73 -
 74
74 -
 75
75 -
 76
76 -
 77
77 -
 78
78 -
 79
79 -
 80
80 -
 81
81 -
82
-
83
-
84
-
85
-
86
-
87
-
88
-
89
-
90
-
91
-
92
-
93
-
94
-
95
-
96
-
97
-
98
-
99
-
100
-
101
-
102
-
103
-
104
-
105
-
106
-
107
-
108
-
109
-
110
-
111
-
112
-
113
-
114
-
115
-
116
-
117
-
118
-
119
-
120
-
121
-
122
-
123
-
124
-
125
-
126
-
127
-
128
-
129
-
130
-
131
-
132
-
133
-
134
-
135
-
136
-
137
-
138
-
139
-
140
-
141
-
142
-
143
-
144
-
145
-
146
-
147
-
148
-
149
-
150
-
151
-
152
-
153
-
154
-
155
-
156
-
157
-
158
-
159
-
160
-
161
-
162
-
163
-
164
-
165
-
166
-
167
-
168
-
169
-
170
-
171
-
172
-
173
-
174
-
175
-
176
-
177
-
178
-
179
-
180
-
181
-
182
-
183
-
184
-
185
-
186
-
187
-
188
-
189
-
190
-
191
-
192
-
193
-
194
-
195
-
196
-
197
-
198
-
199
-
200
 |
 |

HSBC BANK PLC
Report of the Directors: Risk (continued)
69
VaR model limitations
Although a valuable guide to risk, VaR should always be
viewed in the context of its limitations. For example:
• the use of historical data as a proxy for estimating
future events may not encompass all potential
events, particularly those which are extreme in
nature;
• the use of a holding period assumes that all positions
can be liquidated or the risks offset during that
period. This may not fully reflect the market risk
arising at times of severe illiquidity, when the holding
period may be insufficient to liquidate or hedge all
positions fully;
• the use of a 99 per cent confidence level, by
definition does not take into account losses that
might occur beyond this level of confidence;
• VaR is calculated on the basis of exposures
outstanding at the close of business and therefore
does not necessarily reflect intra-day exposures; and
• VaR is unlikely to reflect loss potential on exposures
that only arise under significant market movements.
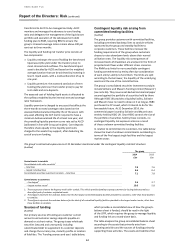
Risk not in VAR framework
(Unaudited)
The group’s VAR model is designed to capture significant
basis risks such as credit default swaps versus Bond,
asset swap spreads and cross-currency basis. Other basis
risks which are not completely covered in VAR, such as
the Libor tenor basis, are complemented by risk-not-in-
VaR (‘RNIV’) calculations and are integrated into the
capital framework.
The RNIV framework therefore aims to capture and
capitalise material market risks that are not adequately
covered in the VAR model. An example of this is Libor
overnight index swap basis risk for minor currencies. In
such instances the RNIV framework uses stress tests to
quantify the capital requirement. On average in 2014,
the capital requirement derived from these stress tests
represented 2.0 per cent of the total internal model-
based market risk requirement.
Risks covered by RNIV represent 15 per cent of market
risk RWAs for models with regulatory approval and
include those resulting from underlying risk factors
which are not observable on a daily basis across asset
classes and products, such as dividend risk and
correlation risks.
Risk factors are reviewed on a regular basis and either
incorporated directly in the VaR models, where possible,
or quantified through the VaR -based RNIV approach or a
stress test approach within the RNIV framework. The
severity of the scenarios is calibrated to be in line with
the capital adequacy requirements. The outcome of the
VaR -based RNIV is included in the VaR calculation and
back-testing; a stressed VaR RNIV is also computed for
the risk factors considered in the VaR-based RNIV
approach. In 2014, we modified our RNIV model on a
non-diversified basis across risk factors to comply with
new PRA CRD IV implementation guidelines.
Level 3 assets
The fair value of Level 3 assets and liabilities in trading
portfolios represent only a small proportion of the
overall trading portfolio. Market risk arising from Level 3
instruments is managed by various market risk
techniques such as stress testing and notional limits.
Stress testing
(Audited)
Stress testing is an important tool that is integrated into
the groups market risk management tool to evaluate the
potential impact on portfolio values of more extreme,
although plausible, events or movements in a set of
financial variables. In such abnormal scenarios, losses
can be much greater than those predicted by VaR
modelling.
Stress testing is implemented at the legal entity, regional
and the overall Group levels. A standard set of scenarios
is utilised consistently across all regions within the
Group. Scenarios are tailored in order to capture the
relevant events or market movements at each level. The
risk appetite around potential stress losses for the Group
is set and monitored against referral limits.
The process is governed by the Stress Testing Review
Group forum which, in conjunction with group risk
management, determines the scenarios to be applied at
portfolio and consolidated level, as follows:
• single risk factor stress scenarios that are unlikely to
be captured within the VaR models, such as the break
of a currency peg;
• technical scenarios consider the largest move in each
risk factor without consideration of any underlying
market correlation;
• hypothetical scenarios consider potential
macroeconomic events, for example, the slowdown in
mainland China and the potential effects of a
sovereign debt default, including its wider contagion
effects; and
• historical scenarios incorporate historical
observations of market movements during previous
periods of stress which would not be captured within
VaR.
Market Risk Reverse stress tests are undertaken based
upon the premise that there is a fixed loss. The stress
test process identifies which scenarios lead to this loss.
The rationale behind the reverse stress test is to
understand scenarios which are beyond normal business
settings that could have contagion and systemic
implications.
Stressed VaR and stress testing, together with reverse
stress testing and the management of gap risk, provide
management with insights regarding the ‘tail risk’
beyond VaR for which HSBC’s appetite is limited.
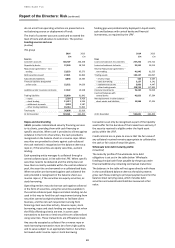
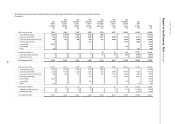
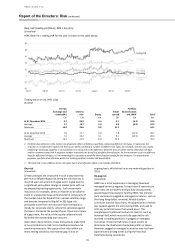
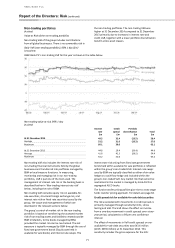
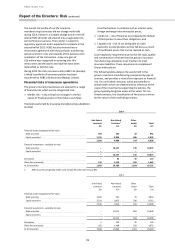
Trading portfolios
(Audited)
Value at Risk of the trading portfolios
Trading VaR predominantly resides within Global
Markets. The total VaR for trading activity was higher at
31 December 2014 compared to 31 December 2013 due
to an increase in interest rate trading VaR, and the
removal of diversification effects within Risk Not in VaR.