HSBC 2014 Annual Report Download - page 18
Download and view the complete annual report
Please find page 18 of the 2014 HSBC annual report below. You can navigate through the pages in the report by either clicking on the pages listed below, or by using the keyword search tool below to find specific information within the annual report.-
 1
1 -
2
-
3
-
4
-
5
-
6
-
7
-
 8
8 -
 9
9 -
 10
10 -
 11
11 -
 12
12 -
 13
13 -
 14
14 -
 15
15 -
 16
16 -
 17
17 -
 18
18 -
 19
19 -
 20
20 -
 21
21 -
 22
22 -
 23
23 -
 24
24 -
 25
25 -
 26
26 -
 27
27 -
 28
28 -
29
-
30
-
31
-
32
-
33
-
34
-
35
-
36
-
37
-
38
-
39
-
40
-
41
-
42
-
43
-
44
-
45
-
46
-
47
-
48
-
49
-
50
-
51
-
52
-
53
-
54
-
55
-
56
-
57
-
58
-
59
-
60
-
61
-
62
-
63
-
64
-
65
-
66
-
67
-
68
-
69
-
70
-
71
-
72
-
73
-
74
-
75
-
76
-
77
-
78
-
79
-
80
-
81
-
82
-
83
-
84
-
85
-
86
-
87
-
88
-
89
-
90
-
91
-
92
-
93
-
94
-
95
-
96
-
97
-
98
-
99
-
100
-
101
-
102
-
103
-
104
-
105
-
106
-
107
-
108
-
109
-
110
-
111
-
112
-
113
-
114
-
115
-
116
-
117
-
118
-
119
-
120
-
121
-
122
-
123
-
124
-
125
-
126
-
127
-
128
-
129
-
130
-
131
-
132
-
133
-
134
-
135
-
136
-
137
-
138
-
139
-
140
-
141
-
142
-
143
-
144
-
145
-
146
-
147
-
148
-
149
-
150
-
151
-
152
-
153
-
154
-
155
-
156
-
157
-
158
-
159
-
160
-
161
-
162
-
163
-
164
-
165
-
166
-
167
-
168
-
169
-
170
-
171
-
172
-
173
-
174
-
175
-
176
-
177
-
178
-
179
-
180
-
181
-
182
-
183
-
184
-
185
-
186
-
187
-
188
-
189
-
190
-
191
-
192
-
193
-
194
-
195
-
196
-
197
-
198
-
199
-
200
 |
 |

HSBC BANK PLC
Strategic Report: Business Review (continued)
16
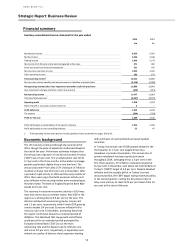
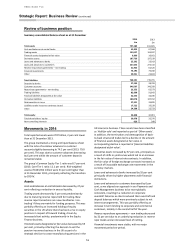
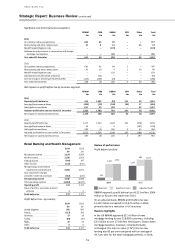
Review of business position
Summary consolidated balance sheet as at 31 December
2014
2013
£m
£m
Total assets
797,289
811,695
Cash and balances at central banks
42,853
67,584
Trading assets
130,127
134,097
Financial assets designated at fair value
6,899
16,661
Derivative assets
187,736
137,239
Loans and advances to banks
25,262
23,013
Loans and advances to customers
257,252
273,722
Reverse repurchase agreements – non-trading
41,945
61,525
Financial investments
76,194
75,030
Other
29,021
22,824
Total liabilities
760,591
778,776
Deposits by banks
27,590
28,769
Customer accounts
346,507
346,358
Repurchase agreements – non-trading
23,353
65,573
Trading liabilities
82,600
91,842
Financial liabilities designated at fair value
22,552
34,036
Derivative liabilities
188,278
137,352
Debt securities in issue
27,921
32,895
Liabilities under insurance contracts issued
17,522
19,228
Other
24,268
22,723
Total equity
36,698
32,919
Total shareholders’ equity
36,078
32,370
Non-controlling interests
620
549
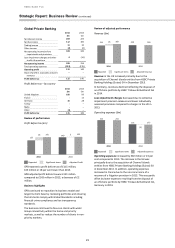
Movements in 2014
Total reported assets were £797 billion, 2 per cent lower
than at 31 December 2013.
The group maintained a strong and liquid balance sheet
with the ratio of customer advances to customer
accounts slightly decreasing to 74.2 per cent (2013: 79.0
per cent). This was due to customer advances decreasing
by 6 per cent whilst the amount of customer deposits
remained stable.
The group’s Common Equity Tier 1 ratio was 8.7 per cent
(2013: Core Tier 1 ratio: 12.1 per cent). Risk-weighted
assets of £243,652 million were 31 per cent higher than
at 31 December 2013, principally reflecting the transition
to CRD IV.
Assets
Cash and balances at central banks decreased by 37 per
cent reflecting a reduction in excess liquidity.
Trading assets decreased by 3 per cent predominantly
due to maturing reverse repos held for trading. New
reverse repo transactions are now classified as ‘non-
trading’ if they are mainly for funding purposes. This was
partially offset by an increased holding of equity
securities in the UK where there has been a rise in equity
positions in respect of forward trading, driven by
increased client activity, predominantly in the Equity
Finance business.
Financial assets designated at fair value decreased by 59
per cent, primarily reflecting the decision to sell the
pension insurance business in the UK as part of a
strategic decision to cease manufacturing pensions in the
UK insurance business. These assets have been classified
as ‘Held for sale’ and reported as part of ‘Other assets’.
In addition, the termination and derecognition of back-
to-back structured trades led to a decline in the amount
of financial assets designated at fair value. A
corresponding decline is reported in ‘financial liabilities
designated at fair value’.
Derivative assets increased by 37 per cent, principally as
a result of shifts in yield curves which led to an increase
in the fair value of interest rate contracts. In addition,
the fair value of foreign exchange contracts increased as
a result of favourable exchange rate movements in the
currency markets.
Loans and advances to banks increased by 10 per cent
principally driven by higher placements with financial
institutions.
Loans and advances to customers decreased by 6 per
cent, as we aligned our approach in our Payments and
Cash Management business to be more globally
consistent, resulting in a reduction in corporate
overdraft balances as clients reduced their overdraft and
deposit balances which were previously subject to net
interest arrangements. This was partially offset by an
increase in term lending to corporate and commercial
customers, notably in the second half of the year.
Reverse repurchase agreements – non trading decreased
by 32 per cent due to an underlying reduction in reverse
repo trades and an increased level of netting.
Financial investments were stable, with no major
movement period-on-period.