HSBC 2014 Annual Report Download - page 145
Download and view the complete annual report
Please find page 145 of the 2014 HSBC annual report below. You can navigate through the pages in the report by either clicking on the pages listed below, or by using the keyword search tool below to find specific information within the annual report.-
 1
1 -
2
-
3
-
4
-
5
-
6
-
7
-
8
-
9
-
10
-
11
-
12
-
13
-
14
-
15
-
16
-
17
-
18
-
19
-
20
-
21
-
22
-
23
-
24
-
25
-
26
-
27
-
28
-
29
-
30
-
31
-
32
-
33
-
34
-
35
-
36
-
37
-
38
-
39
-
40
-
41
-
42
-
43
-
44
-
45
-
46
-
47
-
48
-
49
-
50
-
51
-
52
-
53
-
54
-
55
-
56
-
57
-
58
-
59
-
60
-
61
-
62
-
63
-
64
-
65
-
66
-
67
-
68
-
69
-
70
-
71
-
72
-
73
-
74
-
75
-
76
-
77
-
78
-
79
-
80
-
81
-
82
-
83
-
84
-
85
-
86
-
87
-
88
-
89
-
90
-
91
-
92
-
93
-
94
-
95
-
96
-
97
-
98
-
99
-
100
-
101
-
102
-
103
-
104
-
105
-
106
-
107
-
108
-
109
-
110
-
111
-
112
-
113
-
114
-
115
-
116
-
117
-
118
-
119
-
120
-
121
-
122
-
123
-
124
-
125
-
126
-
127
-
128
-
129
-
130
-
131
-
132
-
133
-
134
-
 135
135 -
 136
136 -
 137
137 -
 138
138 -
 139
139 -
 140
140 -
 141
141 -
 142
142 -
 143
143 -
 144
144 -
 145
145 -
 146
146 -
 147
147 -
 148
148 -
 149
149 -
 150
150 -
 151
151 -
 152
152 -
 153
153 -
 154
154 -
 155
155 -
156
-
157
-
158
-
159
-
160
-
161
-
162
-
163
-
164
-
165
-
166
-
167
-
168
-
169
-
170
-
171
-
172
-
173
-
174
-
175
-
176
-
177
-
178
-
179
-
180
-
181
-
182
-
183
-
184
-
185
-
186
-
187
-
188
-
189
-
190
-
191
-
192
-
193
-
194
-
195
-
196
-
197
-
198
-
199
-
200
 |
 |

HSBC BANK PLC
Notes on the Financial Statements (continued)
143
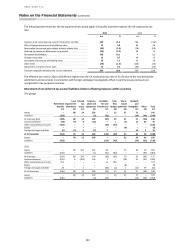
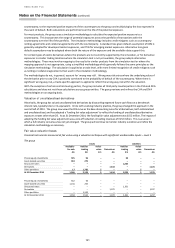
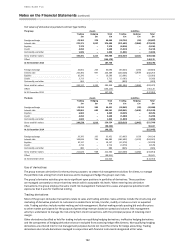
Derivative products valued using valuation techniques with significant unobservable inputs included certain types of
correlation products, such as foreign exchange basket options, equity basket options, foreign exchange interest rate
hybrid transactions and long-dated option transactions. Examples of the latter are equity options, interest rate and
foreign exchange options and certain credit derivatives. Credit derivatives include certain tranched CDS transactions.
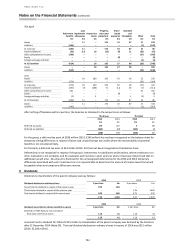
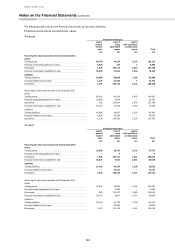
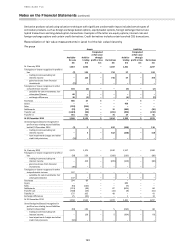
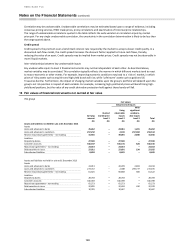
Reconciliation of fair value measurements in Level 3 of the fair value hierarchy
The group
Assets
Liabilities
Available
-
for-sale
Held for
trading
Designated
at fair value
through
profit or loss
Derivatives
Held for
trading
Designated
at fair value
through
profit or loss
Derivatives
£m
£m
£m
£m
£m
£m
£m
At 1 January 2014
1,653
1,562
–
1,072
1,361
–
1,297
Total gains or losses recognised in profit or
loss
(7)
123
–
734
57
–
193
- trading income excluding net
interest income
–
123
–
734
57
–
193
- gains less losses from financial
investments
(7)
–
–
–
–
–
–
Total gains or losses recognised in other
comprehensive income
104
(2)
–
–
(4)
–
(2)
- available-for-sale investments: fair
value gains/(losses)
66
–
–
–
–
–
–
- exchange differences
38
(2)
–
–
(4)
–
(2)
Purchases
666
27
5
–
–
5
–
Issues
–
–
–
–
439
–
–
Sales
(259)
(204)
–
–
–
–
–
Settlements
(79)
(16)
–
15
(385)
–
(90)
Transfer out
(1,023)
(58)
–
(281)
(202)
–
(233)
Transfer in
491
721
–
74
27
–
56
At 31 December 2014
1,546
2,153
5
1,614
1,293
5
1,221
Unrealised gains/(losses) recognised in
profit or loss relating to and liabilities
held at 31 December 2014
(1)
5
–
612
(108)
–
118
- trading income excluding net
interest income
–
5
–
612
(108)
–
118
- loan impairment charges and other
credit risk provisions
(1)
–
–
–
–
–
–
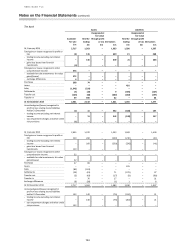
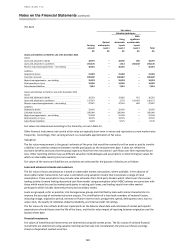
At 1 January 2013
2,071
1,375
–
1,160
1,517
–
1,308
Total gains or losses recognised in profit or
loss
(39)
259
–
(209)
(220)
–
(88)
- trading income excluding net
interest income
–
259
–
(209)
(220)
–
(88)
- gains less losses from financial
investments
(39)
–
–
–
–
–
–
Total gains or losses recognised in other
comprehensive income
107
–
–
–
–
–
–
- available-for-sale investments: fair
value gains/(losses)
107
–
–
–
–
–
–
Purchases
294
89
–
–
–
–
–
Issues
–
–
–
–
683
–
–
Sales
(91)
(110)
–
–
(9)
–
–
Settlements
(251)
(48)
–
87
(603)
–
84
Transfer out
(638)
(43)
–
(14)
(8)
–
(61)
Transfer in
175
105
–
48
–
–
41
Exchange differences
25
(65)
–
–
1
–
13
At 31 December 2013
1,653
1,562
–
1,072
1,361
–
1,297
Unrealised gains/(losses) recognised in
profit or loss relating to and liabilities
held at 31 December
(93)
139
–
5
(264)
–
68
- trading income excluding net
interest income
–
139
–
5
(264)
–
68
- loan impairment charges and other
credit risk provisions
(93)
–
–
–
–
–
–