HSBC 2014 Annual Report Download - page 150
Download and view the complete annual report
Please find page 150 of the 2014 HSBC annual report below. You can navigate through the pages in the report by either clicking on the pages listed below, or by using the keyword search tool below to find specific information within the annual report.-
 1
1 -
2
-
3
-
4
-
5
-
6
-
7
-
8
-
9
-
10
-
11
-
12
-
13
-
14
-
15
-
16
-
17
-
18
-
19
-
20
-
21
-
22
-
23
-
24
-
25
-
26
-
27
-
28
-
29
-
30
-
31
-
32
-
33
-
34
-
35
-
36
-
37
-
38
-
39
-
40
-
41
-
42
-
43
-
44
-
45
-
46
-
47
-
48
-
49
-
50
-
51
-
52
-
53
-
54
-
55
-
56
-
57
-
58
-
59
-
60
-
61
-
62
-
63
-
64
-
65
-
66
-
67
-
68
-
69
-
70
-
71
-
72
-
73
-
74
-
75
-
76
-
77
-
78
-
79
-
80
-
81
-
82
-
83
-
84
-
85
-
86
-
87
-
88
-
89
-
90
-
91
-
92
-
93
-
94
-
95
-
96
-
97
-
98
-
99
-
100
-
101
-
102
-
103
-
104
-
105
-
106
-
107
-
108
-
109
-
110
-
111
-
112
-
113
-
114
-
115
-
116
-
117
-
118
-
119
-
120
-
121
-
122
-
123
-
124
-
125
-
126
-
127
-
128
-
129
-
130
-
131
-
132
-
133
-
134
-
135
-
136
-
137
-
138
-
139
-
 140
140 -
 141
141 -
 142
142 -
 143
143 -
 144
144 -
 145
145 -
 146
146 -
 147
147 -
 148
148 -
 149
149 -
 150
150 -
 151
151 -
 152
152 -
 153
153 -
 154
154 -
 155
155 -
 156
156 -
 157
157 -
 158
158 -
 159
159 -
 160
160 -
161
-
162
-
163
-
164
-
165
-
166
-
167
-
168
-
169
-
170
-
171
-
172
-
173
-
174
-
175
-
176
-
177
-
178
-
179
-
180
-
181
-
182
-
183
-
184
-
185
-
186
-
187
-
188
-
189
-
190
-
191
-
192
-
193
-
194
-
195
-
196
-
197
-
198
-
199
-
200
 |
 |

HSBC BANK PLC
Notes on the Financial Statements (continued)
148
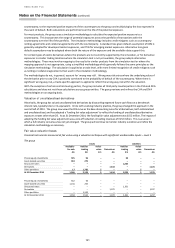
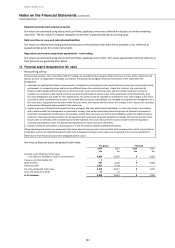
Correlation may be unobservable. Unobservable correlations may be estimated based upon a range of evidence, including
consensus pricing services, HSBC trade prices, proxy correlations and examination of historical price relationships.
The range of unobservable correlations quoted in the table reflects the wide variation in correlation inputs by market
price pair. For any single unobservable correlation, the uncertainty in the correlation determination is likely to be less than
the range quoted above.
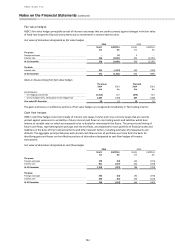
Credit spread
Credit spread is the premium over a benchmark interest rate required by the market to accept a lower credit quality. In a
discounted cash flow model, the credit spread increases the discount factors applied to future cash flows, thereby
reducing the value of an asset. Credit spreads may be implied from market prices. Credit spreads may not be observable in
more illiquid markets.
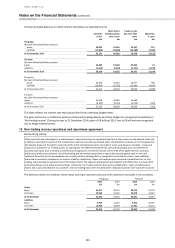
Inter-relationships between key unobservable inputs
Key unobservable inputs to level 3 financial instruments may not be independent of each other. As described above,
market variables may be correlated. This correlation typically reflects the manner in which different markets tend to react
to macro-economic or other events. For example, improving economic conditions may lead to a ‘risk on’ market, in which
prices of risky assets such as equities and high yield bonds will rise, while ‘safe haven’ assets such as gold and US
Treasuries decline. Furthermore, the impact of changing market variables upon the group’s portfolio will depend upon the
group’s net risk position in respect of each variable. For example, increasing high-yield bond prices will benefit long high-
yield bond positions, but the value of any credit derivative protection held against those bonds will fall.
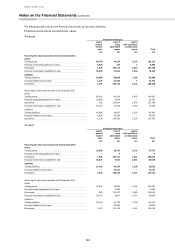
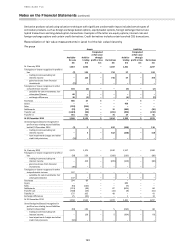
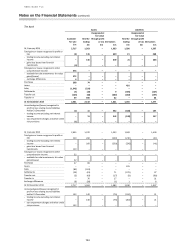
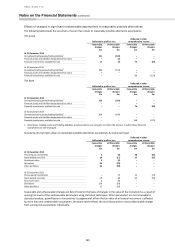
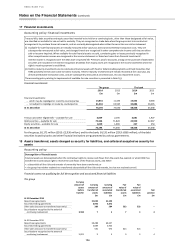
13 Fair values of financial instruments not carried at fair value
The group
Fair values
Valuation techniques
Carrying
amount
Quoted
market price
Level 1
Using
observable
inputs
Level 2
With
significant
unobserv-
able inputs
Level 3
Total
£m
£m
£m
£m
£m
Assets and liabilities not held for sale at 31 December 2014
Assets
Loans and advances to banks
25,262
–
24,061
1,201
25,262
Loans and advances to customers
257,252
–
2,130
257,384
259,514
Reverse repurchase agreements – non-trading
41,945
–
39,055
2,890
41,945
Liabilities
Deposits by banks
27,590
–
27,590
–
27,590
Customer accounts
346,507
–
345,721
824
346,545
Repurchase agreements – non-trading
23,353
–
23,353
–
23,353
Debt securities in issue
27,921
–
27,691
234
27,925
Subordinated liabilities
8,858
–
8,695
–
8,695
Assets and liabilities not held for sale at 31 December 2013
Assets
Loans and advances to banks
23,013
–
20,209
2,804
23,013
Loans and advances to customers
273,722
–
2,388
269,777
272,165
Reverse repurchase agreements – non-trading
61,525
–
60,838
684
61,522
Liabilities
Deposits by banks
28,769
–
28,769
–
28,769
Customer accounts
346,358
–
346,398
–
346,398
Repurchase agreements – non-trading
65,573
–
65,573
–
65,573
Debt securities in issue
32,895
–
32,499
430
32,929
Subordinated liabilities
10,785
–
10,487
–
10,487