HSBC 2014 Annual Report Download - page 164
Download and view the complete annual report
Please find page 164 of the 2014 HSBC annual report below. You can navigate through the pages in the report by either clicking on the pages listed below, or by using the keyword search tool below to find specific information within the annual report.-
 1
1 -
2
-
3
-
4
-
5
-
6
-
7
-
8
-
9
-
10
-
11
-
12
-
13
-
14
-
15
-
16
-
17
-
18
-
19
-
20
-
21
-
22
-
23
-
24
-
25
-
26
-
27
-
28
-
29
-
30
-
31
-
32
-
33
-
34
-
35
-
36
-
37
-
38
-
39
-
40
-
41
-
42
-
43
-
44
-
45
-
46
-
47
-
48
-
49
-
50
-
51
-
52
-
53
-
54
-
55
-
56
-
57
-
58
-
59
-
60
-
61
-
62
-
63
-
64
-
65
-
66
-
67
-
68
-
69
-
70
-
71
-
72
-
73
-
74
-
75
-
76
-
77
-
78
-
79
-
80
-
81
-
82
-
83
-
84
-
85
-
86
-
87
-
88
-
89
-
90
-
91
-
92
-
93
-
94
-
95
-
96
-
97
-
98
-
99
-
100
-
101
-
102
-
103
-
104
-
105
-
106
-
107
-
108
-
109
-
110
-
111
-
112
-
113
-
114
-
115
-
116
-
117
-
118
-
119
-
120
-
121
-
122
-
123
-
124
-
125
-
126
-
127
-
128
-
129
-
130
-
131
-
132
-
133
-
134
-
135
-
136
-
137
-
138
-
139
-
140
-
141
-
142
-
143
-
144
-
145
-
146
-
147
-
148
-
149
-
150
-
151
-
152
-
153
-
 154
154 -
 155
155 -
 156
156 -
 157
157 -
 158
158 -
 159
159 -
 160
160 -
 161
161 -
 162
162 -
 163
163 -
 164
164 -
 165
165 -
 166
166 -
 167
167 -
 168
168 -
 169
169 -
 170
170 -
 171
171 -
 172
172 -
 173
173 -
 174
174 -
175
-
176
-
177
-
178
-
179
-
180
-
181
-
182
-
183
-
184
-
185
-
186
-
187
-
188
-
189
-
190
-
191
-
192
-
193
-
194
-
195
-
196
-
197
-
198
-
199
-
200
 |
 |

HSBC BANK PLC
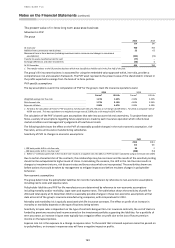
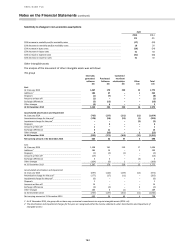
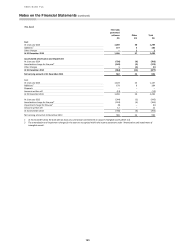
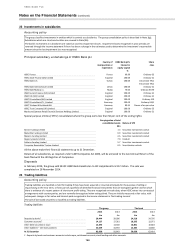
Notes on the Financial Statements (continued)
162
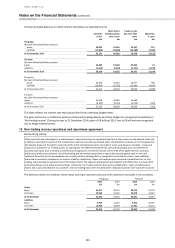
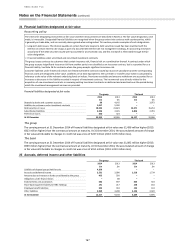
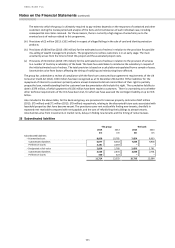
Impairment testing
During 2014, no goodwill impairment was recognised (2013: nil).
Timing of impairment testing
Impairment testing in respect of goodwill is performed at least annually by comparing the recoverable amount of cash-
generating units (‘CGUs’) determined as at 1 July 2014 based on a value in use calculation.
The value in use calculation uses cash flow estimates based on management’s cash flow projections, extrapolated in
perpetuity using a nominal long-term growth rate based on current market assessments of GDP and inflation for the
countries within which the CGU operates. Cash flows are extrapolated in perpetuity due to the long-term perspective
within the group of the business units making up the CGUs. The discount rate used is based on the cost of capital that the
group allocates to investments in the countries within which the CGU operates.
The cost of capital assigned to an individual CGU and used to discount its future cash flows can have a significant effect on
its valuation. The cost of capital percentage is generally derived from an appropriate capital asset pricing model, which
itself depends on inputs reflecting a number of financial and economic variables including the risk-free rate in the country
concerned and a premium or discount to reflect the inherent risk of the business being evaluated. These variables are
established on the basis of management judgement and current market assessments of economic variables.
The review of goodwill impairment represents management’s best estimates of the factors set out above. These values
are sensitive to the cash flows projected for the periods for which detailed forecasts are available, and to assumptions
regarding the long-term sustainable pattern of cash flows thereafter. While the acceptable range within which underlying
assumptions can be applied is governed by the requirement for resulting forecasts to be compared with actual
performance and verifiable economic data in future years, the cash flow forecasts necessarily and appropriately reflect
management’s view of future business prospects. The process of identifying and evaluating goodwill impairment is
inherently uncertain because it requires significant management judgement in making a series of estimations, the results
of which are highly sensitive to the assumptions used.
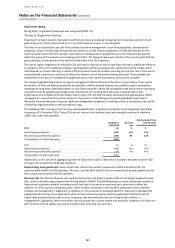
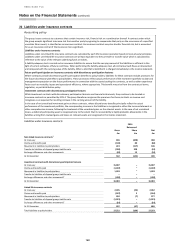
The following CGUs, include in their carrying value goodwill that is a significant proportion of total goodwill reported by
the group at 31 December 2014. These CGUs do not carry on their balance sheet any intangible assets with indefinite
useful lives, other than goodwill.
Goodwill at
1 July 2014
Discount
rate
Nominal growth rate
beyond initial
cash flow projections
2014
£m
%
%
Global Banking and Markets
4,409
11%
4.2%
Retail Banking and Wealth Management
1,260
9%
4.2%
Total goodwill in the CGUs listed above
5,669
2013
£m
%
%
Global Banking and Markets
4,682
10%
3.9%
Retail Banking and Wealth Management
1,338
8%
4.0%
Total goodwill in the CGUs listed above
6,020
Additionally, as at 1 July 2014, aggregate goodwill of £630 million (2013: £668 million) had been allocated to other CGUs
that were not considered individually significant.
Nominal long-term growth rate: external data that reflects the market’s assessment of GDP and inflation for the
countries within which the CGU operates. The rates used for 2014 and 2013 do not exceed the long-term growth rate for
the countries within which the CGU operates.
Discount rate: the after tax discount rate used to discount the cash flows is based on the cost of capital assigned to each
CGU, which is derived using a Capital Asset Pricing Model (‘CAPM’). The CAPM depends on inputs reflecting a number of
financial and economic variables including the risk-free rate in the country concerned and a premium to reflect the
inherent risk of the business being evaluated. These variables are based on the market’s assessment of the economic
variables and management’s judgement. In addition, for the purposes of testing goodwill for impairment, management
supplements this process by comparing the discount rates derived using the internally-generated CAPM with cost of
capital rates produced by external sources. The group uses externally-sourced cost of capital rates where, in
management’s judgement, these rates reflect more accurately the current market and economic conditions. For 2014 and
2013, internal costs of capital rates were consistent with externally-sourced rates.