HSBC 2014 Annual Report Download - page 64
Download and view the complete annual report
Please find page 64 of the 2014 HSBC annual report below. You can navigate through the pages in the report by either clicking on the pages listed below, or by using the keyword search tool below to find specific information within the annual report.-
 1
1 -
2
-
3
-
4
-
5
-
6
-
7
-
8
-
9
-
10
-
11
-
12
-
13
-
14
-
15
-
16
-
17
-
18
-
19
-
20
-
21
-
22
-
23
-
24
-
25
-
26
-
27
-
28
-
29
-
30
-
31
-
32
-
33
-
34
-
35
-
36
-
37
-
38
-
39
-
40
-
41
-
42
-
43
-
44
-
45
-
46
-
47
-
48
-
49
-
50
-
51
-
52
-
53
-
 54
54 -
 55
55 -
 56
56 -
 57
57 -
 58
58 -
 59
59 -
 60
60 -
 61
61 -
 62
62 -
 63
63 -
 64
64 -
 65
65 -
 66
66 -
 67
67 -
 68
68 -
 69
69 -
 70
70 -
 71
71 -
 72
72 -
 73
73 -
 74
74 -
75
-
76
-
77
-
78
-
79
-
80
-
81
-
82
-
83
-
84
-
85
-
86
-
87
-
88
-
89
-
90
-
91
-
92
-
93
-
94
-
95
-
96
-
97
-
98
-
99
-
100
-
101
-
102
-
103
-
104
-
105
-
106
-
107
-
108
-
109
-
110
-
111
-
112
-
113
-
114
-
115
-
116
-
117
-
118
-
119
-
120
-
121
-
122
-
123
-
124
-
125
-
126
-
127
-
128
-
129
-
130
-
131
-
132
-
133
-
134
-
135
-
136
-
137
-
138
-
139
-
140
-
141
-
142
-
143
-
144
-
145
-
146
-
147
-
148
-
149
-
150
-
151
-
152
-
153
-
154
-
155
-
156
-
157
-
158
-
159
-
160
-
161
-
162
-
163
-
164
-
165
-
166
-
167
-
168
-
169
-
170
-
171
-
172
-
173
-
174
-
175
-
176
-
177
-
178
-
179
-
180
-
181
-
182
-
183
-
184
-
185
-
186
-
187
-
188
-
189
-
190
-
191
-
192
-
193
-
194
-
195
-
196
-
197
-
198
-
199
-
200
 |
 |

HSBC BANK PLC
Report of the Directors: Risk (continued)
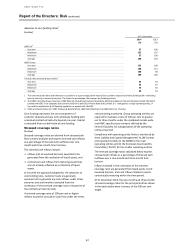
62
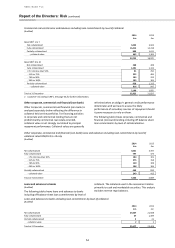
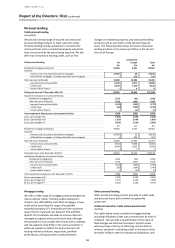
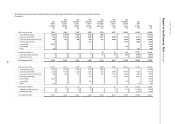
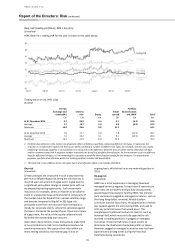
Stressed one-month and three-month coverage ratios1
(Audited)
Stressed one-month coverage
ratios at 31 December
Stressed three-month coverage
ratios at 31 December
2014
(%)
2013
(%)
2014
(%)
2013
(%)
HSBC UK
Year end
117
106
109
109
Maximum
117
114
109
109
Minimum
102
100
103
101
Average
107
106
104
103
HSBC France
Year end
117
110
101
103
Maximum
117
112
106
104
Minimum
104
103
101
100
Average
107
108
102
103
Total of other principal group entities
Year end
110
106
108
102
Maximum
115
113
108
106
Minimum
104
104
102
102
Average
109
108
105
103
1 This ratio measures the liquid assets available to meet net cash outflows over a 30 day/ 90 day period. The higher the percentage, the greater
the liquidity.
The one-month stressed coverage ratio for HSBC UK
increased mainly due to lower contractual repos
positions. The three-month stressed coverage ratio
remained broadly unchanged.
Stressed scenario analysis
(Unaudited)
The group uses a number of standard Group stress
scenarios designed to model:
• combined market-wide and HSBC-specific liquidity
crisis scenarios; and
• market-wide liquidity crisis scenarios.
The appropriateness of the assumptions for each
scenario is reviewed by ALCM regularly and formally
approved by the RMM and the Board annually as part of
the liquidity and funding risk appetite approval process.
Stressed cash outflows are determined by applying a
standard set of prescribed stress assumptions to the
Group’s cash flow model. The group’s framework
prescribes the use of two market-wide scenarios and two
further combined market-wide and HSBC-specific stress
scenarios of increasing severity. In addition to the
group’s standard stress scenarios, individual operating
entities are required to design their own scenarios to
reflect specific local market conditions, products and
funding bases.
The two combined market-wide and HSBC-specific
scenarios model a more severe scenario than the
market-wide scenarios. The relevant combined market-
wide and HSBC-specific stress scenario that an operating
entity manages to is based upon its inherent liquidity risk
categorisation. The key assumptions factored into the
combined market-wide and HSBC-specific stress
scenarios are summarised as follows:
• all non-core deposits are deemed to be withdrawn
within three months (80 per cent within one month),
with the level of non-core deposits dependent on the
operating entity’s inherent liquidity risk
categorisation;
• the ability to access interbank funding and unsecured
term debt markets ceases for the duration of the
scenario;
• the ability to generate funds from illiquid asset
portfolios (securitisation and secured borrowing) is
restricted to 25-75 per cent of the lower of issues in
the last six months or expected issues in the next six
months. The restriction is based on current market
conditions and is dependent on the operating entity’s
inherent liquidity risk categorisation;
• the ability to access repo funding ceases for any asset
not classified as liquid under our liquid asset policy for
the duration of the scenario;
• drawdowns on committed lending facilities must be
consistent with the severity of the market stress
being modelled and dependent on the inherent
liquidity risk categorisation of the operating entity;
• outflows are triggered by a defined downgrade in
long-term ratings. We maintain an ongoing
assessment of the appropriate number of notches to
reflect;
• customer loans are assumed to be renewed at
contractual maturity;
• interbank loans and reverse repos are assumed to run
off contractually; and
• assets defined as liquid assets are assumed to be
realised in cash ahead of their contractual maturity,
after applying a defined stressed haircut of up to 20
per cent.
Liquid assets
(Audited)
The table of the liquid assets shows the estimated
liquidity value (before haircuts) of assets categorised as
liquid used for the purposes of calculating the three
month stressed coverage ratio, as defined under the
Group’s LFRF.