HSBC 2014 Annual Report Download - page 24
Download and view the complete annual report
Please find page 24 of the 2014 HSBC annual report below. You can navigate through the pages in the report by either clicking on the pages listed below, or by using the keyword search tool below to find specific information within the annual report.-
 1
1 -
2
-
3
-
4
-
5
-
6
-
7
-
8
-
9
-
10
-
11
-
12
-
13
-
 14
14 -
 15
15 -
 16
16 -
 17
17 -
 18
18 -
 19
19 -
 20
20 -
 21
21 -
 22
22 -
 23
23 -
 24
24 -
 25
25 -
 26
26 -
 27
27 -
 28
28 -
 29
29 -
 30
30 -
 31
31 -
 32
32 -
 33
33 -
 34
34 -
35
-
36
-
37
-
38
-
39
-
40
-
41
-
42
-
43
-
44
-
45
-
46
-
47
-
48
-
49
-
50
-
51
-
52
-
53
-
54
-
55
-
56
-
57
-
58
-
59
-
60
-
61
-
62
-
63
-
64
-
65
-
66
-
67
-
68
-
69
-
70
-
71
-
72
-
73
-
74
-
75
-
76
-
77
-
78
-
79
-
80
-
81
-
82
-
83
-
84
-
85
-
86
-
87
-
88
-
89
-
90
-
91
-
92
-
93
-
94
-
95
-
96
-
97
-
98
-
99
-
100
-
101
-
102
-
103
-
104
-
105
-
106
-
107
-
108
-
109
-
110
-
111
-
112
-
113
-
114
-
115
-
116
-
117
-
118
-
119
-
120
-
121
-
122
-
123
-
124
-
125
-
126
-
127
-
128
-
129
-
130
-
131
-
132
-
133
-
134
-
135
-
136
-
137
-
138
-
139
-
140
-
141
-
142
-
143
-
144
-
145
-
146
-
147
-
148
-
149
-
150
-
151
-
152
-
153
-
154
-
155
-
156
-
157
-
158
-
159
-
160
-
161
-
162
-
163
-
164
-
165
-
166
-
167
-
168
-
169
-
170
-
171
-
172
-
173
-
174
-
175
-
176
-
177
-
178
-
179
-
180
-
181
-
182
-
183
-
184
-
185
-
186
-
187
-
188
-
189
-
190
-
191
-
192
-
193
-
194
-
195
-
196
-
197
-
198
-
199
-
200
 |
 |

HSBC BANK PLC
Strategic Report: Business Review (continued)
22
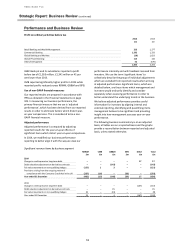
Global Banking and Markets
2014
2013
£m
£m
Net interest income1
1,180
1,101
Net fee income
643
588
Trading income1
1,637
2,192
Other income
219
400
Net operating income before
impairments and provisions
3,679
4,281
Loan impairment charges and other
credit risk provisions
16
(133)
Net operating income
3,695
4,148
Total operating expenses
(3,715)
(3,122)
Operating profit
(20)
1,026
Share of profit in associates and joint
ventures
1
(3)
Profit before tax
(19)
1,023
1 The bank’s Balance Sheet Management business, reported within
GB&M, provides funding to the trading businesses. To report
GB&M Trading income on a fully funded basis, Net interest
income and Trading income are grossed up to reflect internal
funding transactions prior to their elimination in the Inter
Segment column (refer to Note 10).
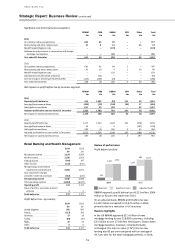
Profit before tax – by country
2014
2013
£m
£m
United Kingdom
(708)
667
France
212
227
Germany
99
115
Turkey
56
70
Malta
17
22
Other1
305
(78)
Profit before tax
(19)
1,023
1 Refer to Madoff related litigation costs in the significant items
table on pages 18 and 19 for details of year-on-year movement.
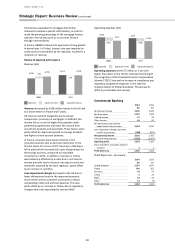
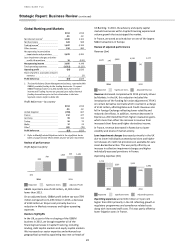
Review of performance
Profit before tax (£m)
GB&M reported a loss of £19 million, £1,042 million
lower than 2013.
On an adjusted basis, GB&M profit before tax was £799
million compared to £1,249 million in 2013, a decrease
of £450 million or 36 per cent primarily due to a
reduction in Markets revenues and higher operating
expenses.
Business highlights
In the UK, as part of the re-shaping of the GB&M
business in 2013, we brought together all of the
financing businesses in Capital Financing, including
lending, debt capital markets and equity capital markets.
We increased our sector expertise and enhanced our
geographical spread by appointing two new co-heads of
UK Banking. In 2014, the advisory and equity capital
markets businesses within Capital Financing experienced
volume growth that outstripped the market.
In France, we acted as sole advisor on one of the largest
M&A transactions in Europe.
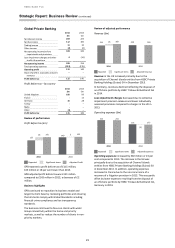
Review of adjusted performance
Revenue (£m)
Revenue decreased compared with 2013 primarily driven
by Markets. In the UK, this reduction included the
introduction of the funding fair value adjustment (‘FFVA’)
on certain derivative contracts which resulted in a charge
of £152 million, affecting Rates and Credit. Revenue also
fell in Foreign Exchange reflecting lower volatility and
reduced client flows. In addition, revenue decreased in
Equities as 2013 benefited from higher revaluation gains,
which more than offset the increase in revenue from
increased client flows and higher derivatives income.
In France, revenue decreased in Rates due to lower
volatility and levels of market activity.
Loan impairment charges decreased primarily in the UK
due to lower individually assessed provisions and higher
net releases of credit risk provisions on available-for-sale
Asset-Backed Securities. This was partly offset by an
increase in collective impairment charges and higher
individually assessed provisions in France.
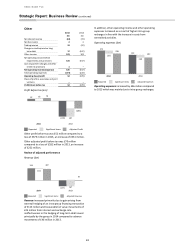
Operating expenses (£m)
Operating expenses were £145 million or 5 per cent
higher than 2013 primarily in the UK reflecting growth in
regulatory programmes and compliance related costs
along with increased staff costs. This was partly offset by
lower litigation costs in France.
(19)
1,023
818
799
226 1,249
2014
2013
Adjusted Profit
Reported
Significant items
3,679 4,281
140 3,819
(4)
4,277
2014
2013
Adjusted RevenueReported
Significant items
3,715
3,122
(678)
3,037
(230)
2,892
2014
2013
Adjusted ExpensesReported
Significant items