HSBC 2014 Annual Report Download - page 17
Download and view the complete annual report
Please find page 17 of the 2014 HSBC annual report below. You can navigate through the pages in the report by either clicking on the pages listed below, or by using the keyword search tool below to find specific information within the annual report.-
 1
1 -
2
-
3
-
4
-
5
-
6
-
 7
7 -
 8
8 -
 9
9 -
 10
10 -
 11
11 -
 12
12 -
 13
13 -
 14
14 -
 15
15 -
 16
16 -
 17
17 -
 18
18 -
 19
19 -
 20
20 -
 21
21 -
 22
22 -
 23
23 -
 24
24 -
 25
25 -
 26
26 -
 27
27 -
28
-
29
-
30
-
31
-
32
-
33
-
34
-
35
-
36
-
37
-
38
-
39
-
40
-
41
-
42
-
43
-
44
-
45
-
46
-
47
-
48
-
49
-
50
-
51
-
52
-
53
-
54
-
55
-
56
-
57
-
58
-
59
-
60
-
61
-
62
-
63
-
64
-
65
-
66
-
67
-
68
-
69
-
70
-
71
-
72
-
73
-
74
-
75
-
76
-
77
-
78
-
79
-
80
-
81
-
82
-
83
-
84
-
85
-
86
-
87
-
88
-
89
-
90
-
91
-
92
-
93
-
94
-
95
-
96
-
97
-
98
-
99
-
100
-
101
-
102
-
103
-
104
-
105
-
106
-
107
-
108
-
109
-
110
-
111
-
112
-
113
-
114
-
115
-
116
-
117
-
118
-
119
-
120
-
121
-
122
-
123
-
124
-
125
-
126
-
127
-
128
-
129
-
130
-
131
-
132
-
133
-
134
-
135
-
136
-
137
-
138
-
139
-
140
-
141
-
142
-
143
-
144
-
145
-
146
-
147
-
148
-
149
-
150
-
151
-
152
-
153
-
154
-
155
-
156
-
157
-
158
-
159
-
160
-
161
-
162
-
163
-
164
-
165
-
166
-
167
-
168
-
169
-
170
-
171
-
172
-
173
-
174
-
175
-
176
-
177
-
178
-
179
-
180
-
181
-
182
-
183
-
184
-
185
-
186
-
187
-
188
-
189
-
190
-
191
-
192
-
193
-
194
-
195
-
196
-
197
-
198
-
199
-
200
 |
 |

HSBC BANK PLC
Strategic Report: Business Review (continued)
15
independent financial advisor distribution channels in
the UK in 2013.
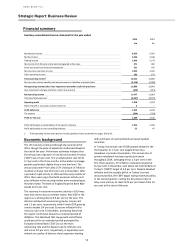
Other operating income was broadly in line with 2013. A
gain arising from external hedging of an intra-group
financing transaction was mostly offset by a decrease in
the Present Value of In-Force (‘PVIF’) long term
insurance business in France RBWM.
Net insurance claims, benefits paid and movement in
liabilities to policyholders decreased by £712 million or
24 per cent. This reflected a net trading loss on economic
hedges and a decrease in business volumes. In addition,
there was a decrease in investment returns on assets
held to support policyholder contracts where the
policyholder bears investment risk from weaker equity
market movements in 2014 compared to 2013 in the UK
and France.
Loan impairment charges and other credit risk provisions
decreased by £522 million or 54 per cent. This was due
to lower individually assessed provisions in UK CMB
reflecting improved portfolio quality and the economic
environment. GB&M in the UK recorded reduced loan
impairment charges due to lower individually assessed
provisions and higher net releases of credit risk
provisions on available-for-sale asset backed securities.
This was partly offset by an increase due to a revision in
certain estimates in our corporate collective loan
impairment calculation. In RBWM, loan impairment
charges decreased as a result of lower delinquency levels
in the improved economic environment and as
customers continued to reduce outstanding credit card
and loan balances.
Total operating expenses increased by £912 million or 11
per cent. This was primarily due to a number of
significant items including settlements and provisions in
connection with foreign exchange investigations in
GB&M and the non-recurrence of a 2013 accounting gain
of £280 million arising from a change in basis of
delivering ill-health benefits in the UK. In addition
expenses were higher due to the timing of the
recognition of the Financial Services Compensation
Scheme (‘FSCS’) levy in the UK and from growth in
regulatory programmes and compliance related costs
across all of our businesses.
The increase in expenses was partially offset by lower
litigation costs. Customer redress provisions broadly
remained in line with 2013. Litigation related expenses
decreased by £365 million, reflecting an insurance
recovery recognised in 2014 relating to Madoff litigation
costs that had been recognised in 2013, and which did
not recur in 2014. Compared to 2013, redress provisions
did not include a £96 million charge relating to
investment advice redress, but included an additional
charge of £583 million (2013: £483 million) for estimated
redress for possible mis-selling in previous years of
payment protection insurance (‘PPI’) policies and £175
million (2013: £166 million) in respect of interest rate
protection products.
During 2014 the group maintained its strict cost control
discipline and benefited from the delivery of
organisational effectiveness programmes. The number of
employees, expressed in fulltime equivalent numbers at
the end of 2014 was 1 per cent higher compared to
2013. This was primarily as a result of the initiatives
related to Regulatory Programmes and Compliance in
part offset by sustainable savings programmes and
business disposals.
Tax expense totalled £564 million in 2014, compared to
£754 million in 2013. The effective tax rate for 2014 was
28.9 per cent, compared to 22.9 per cent in 2013.
The effective tax rate for 2014 of 28.9 per cent was
higher than the UK corporation tax rate of 21.5 per cent
due to the non-deductible settlements and provisions in
connection with foreign exchange investigations offset in
part by the recognition of losses previously not
recognised for tax purposes overseas.