HSBC 2014 Annual Report Download - page 108
Download and view the complete annual report
Please find page 108 of the 2014 HSBC annual report below. You can navigate through the pages in the report by either clicking on the pages listed below, or by using the keyword search tool below to find specific information within the annual report.-
 1
1 -
2
-
3
-
4
-
5
-
6
-
7
-
8
-
9
-
10
-
11
-
12
-
13
-
14
-
15
-
16
-
17
-
18
-
19
-
20
-
21
-
22
-
23
-
24
-
25
-
26
-
27
-
28
-
29
-
30
-
31
-
32
-
33
-
34
-
35
-
36
-
37
-
38
-
39
-
40
-
41
-
42
-
43
-
44
-
45
-
46
-
47
-
48
-
49
-
50
-
51
-
52
-
53
-
54
-
55
-
56
-
57
-
58
-
59
-
60
-
61
-
62
-
63
-
64
-
65
-
66
-
67
-
68
-
69
-
70
-
71
-
72
-
73
-
74
-
75
-
76
-
77
-
78
-
79
-
80
-
81
-
82
-
83
-
84
-
85
-
86
-
87
-
88
-
89
-
90
-
91
-
92
-
93
-
94
-
95
-
96
-
97
-
 98
98 -
 99
99 -
 100
100 -
 101
101 -
 102
102 -
 103
103 -
 104
104 -
 105
105 -
 106
106 -
 107
107 -
 108
108 -
 109
109 -
 110
110 -
 111
111 -
 112
112 -
 113
113 -
 114
114 -
 115
115 -
 116
116 -
 117
117 -
 118
118 -
119
-
120
-
121
-
122
-
123
-
124
-
125
-
126
-
127
-
128
-
129
-
130
-
131
-
132
-
133
-
134
-
135
-
136
-
137
-
138
-
139
-
140
-
141
-
142
-
143
-
144
-
145
-
146
-
147
-
148
-
149
-
150
-
151
-
152
-
153
-
154
-
155
-
156
-
157
-
158
-
159
-
160
-
161
-
162
-
163
-
164
-
165
-
166
-
167
-
168
-
169
-
170
-
171
-
172
-
173
-
174
-
175
-
176
-
177
-
178
-
179
-
180
-
181
-
182
-
183
-
184
-
185
-
186
-
187
-
188
-
189
-
190
-
191
-
192
-
193
-
194
-
195
-
196
-
197
-
198
-
199
-
200
 |
 |

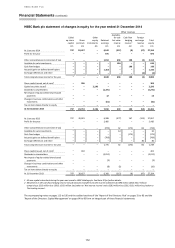
HSBC BANK PLC
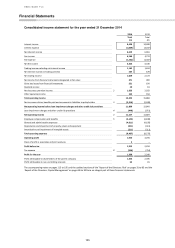
Financial Statements (continued)
106
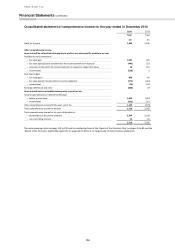
Consolidated statement of comprehensive income for the year ended 31 December 2014
2014
2013
Total
Total
£m
£m
Profit for the year
1,389
2,540
Other comprehensive income
Items that will be reclassified subsequently to profit or loss when specific conditions are met
Available-for-sale investments
– fair value gain
1,033
420
– fair value (gains)/losses transferred to the income statement on disposal
(407)
223
– amounts transferred to the income statement in respect of impairment losses
36
115
– income taxes
(218)
2
Cash flow hedges
– fair value gains
838
46
– fair value (gains) transferred to the income statement
(575)
(423)
– income taxes
(74)
109
Exchange differences and other
(820)
39
Items that will not be reclassified subsequently to profit or loss
Actuarial gains/(losses) on defined benefit plans
– before income taxes
1,638
(957)
– income taxes
(322)
251
Other comprehensive income for the year, net of tax
1,129
(175)
Total comprehensive income for the year
2,518
2,365
Total comprehensive income for the year attributable to:
– shareholders of the parent company
2,504
2,319
– non-controlling interests
14
46
2,518
2,365
The accompanying notes on pages 113 to 195 and the audited sections of the ‘Report of the Directors: Risk’ on pages 31 to 83 and the
‘Report of the Directors: Capital Management’ on pages 84 to 93 form an integral part of these financial statements.