HSBC 2014 Annual Report Download - page 178
Download and view the complete annual report
Please find page 178 of the 2014 HSBC annual report below. You can navigate through the pages in the report by either clicking on the pages listed below, or by using the keyword search tool below to find specific information within the annual report.-
 1
1 -
2
-
3
-
4
-
5
-
6
-
7
-
8
-
9
-
10
-
11
-
12
-
13
-
14
-
15
-
16
-
17
-
18
-
19
-
20
-
21
-
22
-
23
-
24
-
25
-
26
-
27
-
28
-
29
-
30
-
31
-
32
-
33
-
34
-
35
-
36
-
37
-
38
-
39
-
40
-
41
-
42
-
43
-
44
-
45
-
46
-
47
-
48
-
49
-
50
-
51
-
52
-
53
-
54
-
55
-
56
-
57
-
58
-
59
-
60
-
61
-
62
-
63
-
64
-
65
-
66
-
67
-
68
-
69
-
70
-
71
-
72
-
73
-
74
-
75
-
76
-
77
-
78
-
79
-
80
-
81
-
82
-
83
-
84
-
85
-
86
-
87
-
88
-
89
-
90
-
91
-
92
-
93
-
94
-
95
-
96
-
97
-
98
-
99
-
100
-
101
-
102
-
103
-
104
-
105
-
106
-
107
-
108
-
109
-
110
-
111
-
112
-
113
-
114
-
115
-
116
-
117
-
118
-
119
-
120
-
121
-
122
-
123
-
124
-
125
-
126
-
127
-
128
-
129
-
130
-
131
-
132
-
133
-
134
-
135
-
136
-
137
-
138
-
139
-
140
-
141
-
142
-
143
-
144
-
145
-
146
-
147
-
148
-
149
-
150
-
151
-
152
-
153
-
154
-
155
-
156
-
157
-
158
-
159
-
160
-
161
-
162
-
163
-
164
-
165
-
166
-
167
-
 168
168 -
 169
169 -
 170
170 -
 171
171 -
 172
172 -
 173
173 -
 174
174 -
 175
175 -
 176
176 -
 177
177 -
 178
178 -
 179
179 -
 180
180 -
 181
181 -
 182
182 -
 183
183 -
 184
184 -
 185
185 -
 186
186 -
 187
187 -
 188
188 -
189
-
190
-
191
-
192
-
193
-
194
-
195
-
196
-
197
-
198
-
199
-
200
 |
 |

HSBC BANK PLC
Notes on the Financial Statements (continued)
176
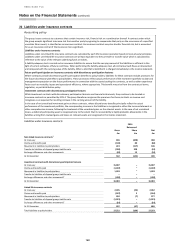
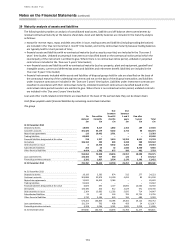
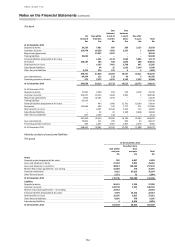
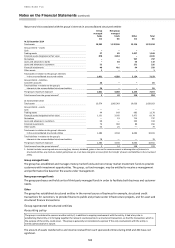
30 Offsetting of financial assets and financial liabilities
Accounting
Financial assets and financial liabilities are offset and the net amount is reported in the balance sheet when there is a legally
enforceable right to offset the recognised amounts and there is an intention to settle on a net basis, or realise the asset and settle the
liability simultaneously (‘the offset criteria’).
Gross
amounts of
recognised
financial
instruments
Gross
amounts
offset in the
balance
sheet
Amounts
presented
in the
balance
sheet
Amounts not offset in the
balance sheet
Net
amount
Financial
instruments
1
Cash
collateral
received/
pledged
£m
£m
£m
£m
£m
£m
Financial assets
Derivatives2
333,906
(146,170)
187,736
(150,460)
(23,672)
13,604
Reverse repurchase, securities borrowing and
similar agreements
88,338
(40,812)
47,526
(47,368)
(158)
–
Classified as:
– trading assets
5,831
(250)
5,581
(5,581)
–
–
– non-trading assets
82,507
(40,562)
41,945
(41,787)
(158)
–
Loans and advances to customers at
amortised cost
61,912
(22,182)
39,730
(35,920)
–
3,810
At 31 December 2014
484,156
(209,164)
274,992
(233,748)
(23,830)
17,414
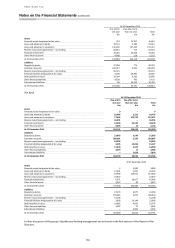
Financial liabilities
Derivatives2
334,448
(146,170)
188,278
(151,340)
(23,581)
13,357
Repurchase, securities lending and similar
agreements
78,121
(40,812)
37,309
(37,244)
(65)
–
Classified as:
– trading liabilities
14,206
(250)
13,956
(13,956)
–
–
– non-trading liabilities
63,915
(40,562)
23,353
(23,288)
(65)
–
Customer accounts at amortised cost
66,217
(22,182)
44,035
(35,920)
–
8,115
At 31 December 2014
478,786
(209,164)
269,622
(224,504)
(23,646)
21,472
Financial assets
Derivatives2
293,359
(156,120)
137,239
(96,018)
(16,913)
24,308
Reverse repurchase, securities borrowing and
similar agreements
115,261
(41,888)
73,373
(73,337)
(33)
3
Classified as:
– trading assets
23,082
(11,234)
11,848
(11,848)
–
–
– non-trading assets
92,179
(30,654)
61,525
(61,489)
(33)
3
Loans and advances to customers at
amortised cost
111,695
(54,236)
57,459
(54,076)
–
3,383
At 31 December 2013
520,315
(252,244)
268,071
(223,431)
(16,946)
27,694
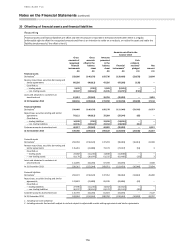
Financial liabilities
Derivatives2
293,472
(156,120)
137,352
(96,462)
(14,610)
26,280
Repurchase, securities lending and similar
agreements
123,823
(41,888)
81,935
(81,886)
(49)
–
Classified as:
– trading liabilities
27,596
(11,234)
16,362
(16,362)
–
–
– non-trading liabilities
96,227
(30,654)
65,573
(65,524)
(49)
–
Customer accounts at amortised cost
115,739
(54,236)
61,503
(54,076)
–
7,427
At 31 December 2013
533,034
(252,244)
280,790
(232,424)
(14,659)
33,707
1 Including non-cash collateral.
2 Including amounts that are both subject to and not subject to enforceable master netting agreements and similar agreements.