HSBC 2014 Annual Report Download - page 140
Download and view the complete annual report
Please find page 140 of the 2014 HSBC annual report below. You can navigate through the pages in the report by either clicking on the pages listed below, or by using the keyword search tool below to find specific information within the annual report.-
 1
1 -
2
-
3
-
4
-
5
-
6
-
7
-
8
-
9
-
10
-
11
-
12
-
13
-
14
-
15
-
16
-
17
-
18
-
19
-
20
-
21
-
22
-
23
-
24
-
25
-
26
-
27
-
28
-
29
-
30
-
31
-
32
-
33
-
34
-
35
-
36
-
37
-
38
-
39
-
40
-
41
-
42
-
43
-
44
-
45
-
46
-
47
-
48
-
49
-
50
-
51
-
52
-
53
-
54
-
55
-
56
-
57
-
58
-
59
-
60
-
61
-
62
-
63
-
64
-
65
-
66
-
67
-
68
-
69
-
70
-
71
-
72
-
73
-
74
-
75
-
76
-
77
-
78
-
79
-
80
-
81
-
82
-
83
-
84
-
85
-
86
-
87
-
88
-
89
-
90
-
91
-
92
-
93
-
94
-
95
-
96
-
97
-
98
-
99
-
100
-
101
-
102
-
103
-
104
-
105
-
106
-
107
-
108
-
109
-
110
-
111
-
112
-
113
-
114
-
115
-
116
-
117
-
118
-
119
-
120
-
121
-
122
-
123
-
124
-
125
-
126
-
127
-
128
-
129
-
 130
130 -
 131
131 -
 132
132 -
 133
133 -
 134
134 -
 135
135 -
 136
136 -
 137
137 -
 138
138 -
 139
139 -
 140
140 -
 141
141 -
 142
142 -
 143
143 -
 144
144 -
 145
145 -
 146
146 -
 147
147 -
 148
148 -
 149
149 -
 150
150 -
151
-
152
-
153
-
154
-
155
-
156
-
157
-
158
-
159
-
160
-
161
-
162
-
163
-
164
-
165
-
166
-
167
-
168
-
169
-
170
-
171
-
172
-
173
-
174
-
175
-
176
-
177
-
178
-
179
-
180
-
181
-
182
-
183
-
184
-
185
-
186
-
187
-
188
-
189
-
190
-
191
-
192
-
193
-
194
-
195
-
196
-
197
-
198
-
199
-
200
 |
 |

HSBC BANK PLC
Notes on the Financial Statements (continued)
138
outcomes must be considered. In addition, the value of some products is dependent on more than one market factor, and in these
cases it will typically be necessary to consider how movements in one market factor may affect the other market factors. The model
inputs necessary to perform such calculations include interest rate yield curves, exchange rates, volatilities, correlations, prepayment
and default rates. For interest rate derivatives with collateralised counterparties and in significant currencies, HSBC uses a discounting
curve that reflects the overnight interest rate (‘OIS’).
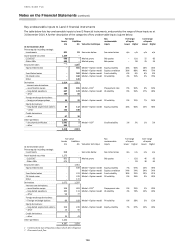
The majority of valuation techniques employ only observable market data. However, certain financial instruments are valued on the
basis of valuation techniques that feature one or more significant market inputs that are unobservable, and for them the
measurement of fair value is more judgemental. An instrument in its entirety is classified as valued using significant unobservable
inputs if, in the opinion of management, a significant proportion of the instrument’s inception profit or greater than 5% of the
instrument’s valuation is driven by unobservable inputs. ‘Unobservable’ in this context means that there is little or no current market
data available from which to determine the price at which an arm’s length transaction would be likely to occur. It generally does not
mean that there is no data available at all upon which to base a determination of fair value (consensus pricing data may, for example,
be used).
Control framework
Fair values are subject to a control framework designed to ensure that they are either determined, or validated, by a
function independent of the risk-taker.
For all financial instruments where fair values are determined by reference to externally quoted prices or observable
pricing inputs to models, independent price determination or validation is utilised. In inactive markets, direct observation
of a traded price may not be possible. In these circumstances, the group will source alternative market information to
validate the financial instrument’s fair value, with greater weight given to information that is considered to be more
relevant and reliable. The factors that are considered in this regard are, inter alia:
• the extent to which prices may be expected to represent genuine traded or tradable prices;
• the degree of similarity between financial instruments;
• the degree of consistency between different sources;
• the process followed by the pricing provider to derive the data;
• the elapsed time between the date to which the market data relates and the balance sheet date; and
• the manner in which the data was sourced.
For fair values determined using a valuation model, the control framework may include, as applicable, development or
validation by independent support functions of (i) the logic within valuation models; (ii) the inputs to those models;
(iii) any adjustments required outside the valuation models; and, where possible, (iv) model outputs. Valuation models
are subject to a process of due diligence and calibration before becoming data on an ongoing basis.
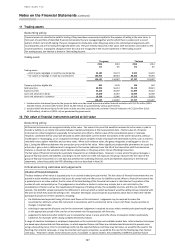
Financial liabilities measured at fair value
In certain circumstances, the group records its own debt in issue at fair value, based on quoted prices in an active market
for the specific instrument concerned, where available. An example of this is where own debt in issue is hedged with
interest rate derivatives. When quoted market prices are unavailable, the own debt in issue is valued using valuation
techniques, the inputs for which are either based upon quoted prices in an inactive market for the instrument, or are
estimated by comparison with quoted prices in an active market for similar instruments. In both cases, the fair value
includes the effect of applying the credit spread which is appropriate to the group’s liability. The change in fair value of
issued debt securities attributable to the group’s own credit spread is computed as follows: for each security at each
reporting date, an externally verifiable price is obtained or a price is derived using credit spreads for similar securities for
the same issuer. Then, using discounted cash flow, each security is valued using a LIBOR-based discount curve. The
difference in the valuations is attributable to the group’s own credit spread. This methodology is applied consistently
across all securities.
Structured notes issued and certain other hybrid instrument liabilities are included within trading liabilities and are
measured at fair value. The credit spread applied to these instruments is derived from the spreads at which the group
issues structured notes.
Gains and losses arising from changes in the credit spread of liabilities issued by the group reverse over the contractual
life of the debt, provided that the debt is not repaid at a premium or a discount.
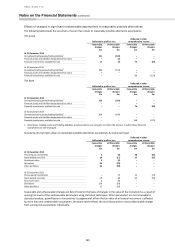
Changes in fair value are generally subject to a profit and loss analysis process. This process disaggregates changes in fair
value into three high level categories; (i) portfolio changes, such as new transactions or maturing transactions, (ii) market
movements, such as changes in foreign exchange rates or equity prices, and (iii) other, such as changes in fair value
adjustments, discussed below.
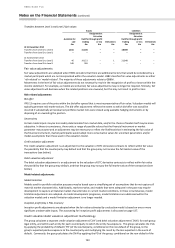
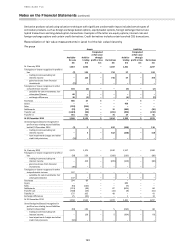
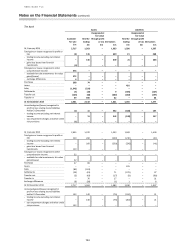
Fair value hierarchy
Fair values are determined according to the following hierarchy:
• Level 1 – quoted market price: financial instruments with quoted prices for identical instruments in active markets.
• Level 2 – valuation technique using observable inputs: financial instruments with quoted prices for similar instruments
in active markets or quoted prices for identical or similar instruments in inactive markets and financial instruments
valued using models where all significant inputs are observable.
• Level 3 – valuation technique with significant unobservable inputs: financial instruments valued using models where
one or more significant inputs are unobservable.