HSBC 2014 Annual Report Download - page 70
Download and view the complete annual report
Please find page 70 of the 2014 HSBC annual report below. You can navigate through the pages in the report by either clicking on the pages listed below, or by using the keyword search tool below to find specific information within the annual report.-
 1
1 -
2
-
3
-
4
-
5
-
6
-
7
-
8
-
9
-
10
-
11
-
12
-
13
-
14
-
15
-
16
-
17
-
18
-
19
-
20
-
21
-
22
-
23
-
24
-
25
-
26
-
27
-
28
-
29
-
30
-
31
-
32
-
33
-
34
-
35
-
36
-
37
-
38
-
39
-
40
-
41
-
42
-
43
-
44
-
45
-
46
-
47
-
48
-
49
-
50
-
51
-
52
-
53
-
54
-
55
-
56
-
57
-
58
-
59
-
 60
60 -
 61
61 -
 62
62 -
 63
63 -
 64
64 -
 65
65 -
 66
66 -
 67
67 -
 68
68 -
 69
69 -
 70
70 -
 71
71 -
 72
72 -
 73
73 -
 74
74 -
 75
75 -
 76
76 -
 77
77 -
 78
78 -
 79
79 -
 80
80 -
81
-
82
-
83
-
84
-
85
-
86
-
87
-
88
-
89
-
90
-
91
-
92
-
93
-
94
-
95
-
96
-
97
-
98
-
99
-
100
-
101
-
102
-
103
-
104
-
105
-
106
-
107
-
108
-
109
-
110
-
111
-
112
-
113
-
114
-
115
-
116
-
117
-
118
-
119
-
120
-
121
-
122
-
123
-
124
-
125
-
126
-
127
-
128
-
129
-
130
-
131
-
132
-
133
-
134
-
135
-
136
-
137
-
138
-
139
-
140
-
141
-
142
-
143
-
144
-
145
-
146
-
147
-
148
-
149
-
150
-
151
-
152
-
153
-
154
-
155
-
156
-
157
-
158
-
159
-
160
-
161
-
162
-
163
-
164
-
165
-
166
-
167
-
168
-
169
-
170
-
171
-
172
-
173
-
174
-
175
-
176
-
177
-
178
-
179
-
180
-
181
-
182
-
183
-
184
-
185
-
186
-
187
-
188
-
189
-
190
-
191
-
192
-
193
-
194
-
195
-
196
-
197
-
198
-
199
-
200
 |
 |

HSBC BANK PLC
Report of the Directors: Risk (continued)
68
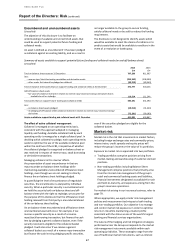
rate swaps, to more sophisticated hedging strategies to
address a combination of risk factors arising at portfolio
level.
Market risk governance
(Audited)
Market risk is managed and controlled through limits
approved by the RMM of the Group Management Board
(‘GMB’) for HSBC Holdings and the global businesses.
These limits are allocated across business lines and
agreed with the Group’s legal entities, including HSBC
Bank plc.
The management of market risk is principally undertaken
in Markets using risk limits allocated from the risk
appetite, which is subject to the Group RMM ratification.
Limits are set for portfolios, products and risk types, with
market liquidity being a primary factor in determining
the level of limits set.
Group Risk, as an independent, is responsible for HSBC’s
market risk management policies and measurement
techniques. Each major operating entity has an
independent market risk management and control
function which is responsible for measuring market risk
exposures in accordance with the policies defined by
Group Risk, and monitoring and reporting these
exposures against the prescribed limits on a daily basis.
Each operating entity is required to assess the market
risks arising on each product in its business and to
transfer them to either its local Markets unit for
management, or to separate books managed under the
supervision of the local ALCO.
The aim is to ensure that all market risks are
consolidated within operations which have the necessary
skills, tools, management and governance to manage
them professionally. In certain cases where the market
risks cannot be fully transferred, the group identifies the
impact of varying scenarios on valuations or on net
interest income resulting from any residual risk
positions.
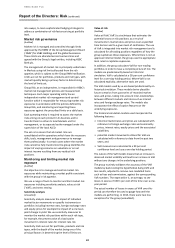
Monitoring and limiting market risk
exposure
(Audited)
Our objective is to manage and control market risk
exposures while maintaining a market profile consistent
with the group’s risk appetite.
We use a range of tools to monitor and limit market risk
exposures including sensitivity analysis, value at risk
(‘VaR’), and stress testing.
Sensitivity analysis
(Unaudited)
Sensitivity analysis measures the impact of individual
market factor movements on specific instruments or
portfolios including interest rates, foreign exchange rates
and equity prices for example the impact of a one basis
point change in yield. We use sensitivity measures to
monitor the market risk positions within each risk type,
for example, the present value of a basis point
movement in interest rates for interest rate risk.
Sensitivity limits are set for portfolios, products and risk
types, with the depth of the market being one of the
principal factors in determining the level of limits set.
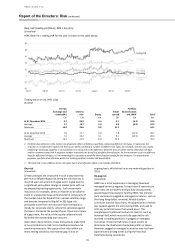
Value at risk
(Audited)
Value at Risk (‘VaR’) is a technique that estimates the
potential losses on risk positions as a result of
movements in market rates and prices over a specified
time horizon and to a given level of confidence. The use
of VaR is integrated into market risk management and is
calculated for all trading positions regardless of how the
group capitalises those exposures. Where there is not an
approved internal model, the group uses the appropriate
local rules to capitalise exposures.
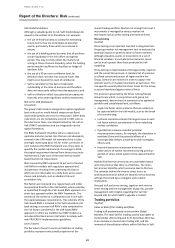
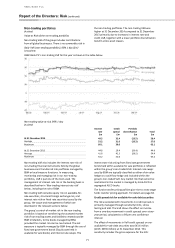
In addition, the group calculates VaR for non-trading
portfolios in order to have a complete picture of risk. The
models are predominantly based on historical
simulation. VaR is calculated at a 99 per cent confidence
level for a one-day holding period. Where VaR is not
calculated explicitly, alternative tools are used.
The VaR models used by us are based predominantly on
historical simulation. These models derive plausible
future scenarios from past series of recorded market
rates and prices, taking into account inter-relationships
between different markets and rates such as interest
rates and foreign exchange rates. The models also
incorporate the effect of option features on the
underlying exposures.
The historical simulation models used incorporate the
following features:
• historical market rates and prices are calculated with
reference to foreign exchange rates and commodity
prices, interest rates, equity prices and the associated
volatilities;
• potential market movements utilised for VaR are
calculated with reference to data from the past two
years; and
• VaR measures are calculated to a 99 per cent
confidence level and use a one-day holding period.
The nature of the VaR models means that an increase in
observed market volatility will lead to an increase in VaR
without any changes in the underlying positions.
The group routinely validates the accuracy of the VAR
models by back-testing the hypothetical daily profit and
loss results, adjusted to remove non-modelled items
such as fees and commissions, against the corresponding
VaR numbers. The expectation is, on average, to see
losses in excess of VAR 1 per cent of the time over a one-
year period.
The actual number of losses in excess of VAR over this
period can therefore be used to gauge how well the
models are performing. In 2014, there were two loss
exceptions for the group (unaudited).