HSBC 2014 Annual Report Download - page 113
Download and view the complete annual report
Please find page 113 of the 2014 HSBC annual report below. You can navigate through the pages in the report by either clicking on the pages listed below, or by using the keyword search tool below to find specific information within the annual report.-
 1
1 -
2
-
3
-
4
-
5
-
6
-
7
-
8
-
9
-
10
-
11
-
12
-
13
-
14
-
15
-
16
-
17
-
18
-
19
-
20
-
21
-
22
-
23
-
24
-
25
-
26
-
27
-
28
-
29
-
30
-
31
-
32
-
33
-
34
-
35
-
36
-
37
-
38
-
39
-
40
-
41
-
42
-
43
-
44
-
45
-
46
-
47
-
48
-
49
-
50
-
51
-
52
-
53
-
54
-
55
-
56
-
57
-
58
-
59
-
60
-
61
-
62
-
63
-
64
-
65
-
66
-
67
-
68
-
69
-
70
-
71
-
72
-
73
-
74
-
75
-
76
-
77
-
78
-
79
-
80
-
81
-
82
-
83
-
84
-
85
-
86
-
87
-
88
-
89
-
90
-
91
-
92
-
93
-
94
-
95
-
96
-
97
-
98
-
99
-
100
-
101
-
102
-
 103
103 -
 104
104 -
 105
105 -
 106
106 -
 107
107 -
 108
108 -
 109
109 -
 110
110 -
 111
111 -
 112
112 -
 113
113 -
 114
114 -
 115
115 -
 116
116 -
 117
117 -
 118
118 -
 119
119 -
 120
120 -
 121
121 -
 122
122 -
 123
123 -
124
-
125
-
126
-
127
-
128
-
129
-
130
-
131
-
132
-
133
-
134
-
135
-
136
-
137
-
138
-
139
-
140
-
141
-
142
-
143
-
144
-
145
-
146
-
147
-
148
-
149
-
150
-
151
-
152
-
153
-
154
-
155
-
156
-
157
-
158
-
159
-
160
-
161
-
162
-
163
-
164
-
165
-
166
-
167
-
168
-
169
-
170
-
171
-
172
-
173
-
174
-
175
-
176
-
177
-
178
-
179
-
180
-
181
-
182
-
183
-
184
-
185
-
186
-
187
-
188
-
189
-
190
-
191
-
192
-
193
-
194
-
195
-
196
-
197
-
198
-
199
-
200
 |
 |

HSBC BANK PLC
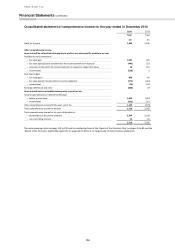
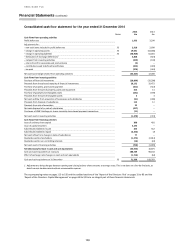
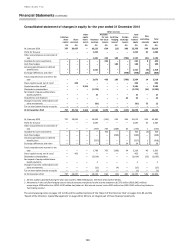
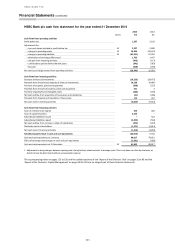
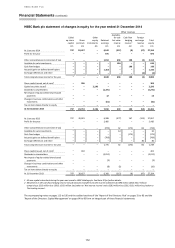
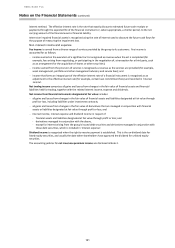
Financial Statements (continued)
111
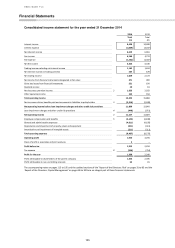
HSBC Bank plc cash flow statement for the year ended 31 December 2014
2014
2013
Notes
£m
£m
Cash flows from operating activities
Profit before tax
1,367
2,913
Adjustments for:
– non-cash items included in profit before tax
33
2,527
2,008
– change in operating assets
33
18,204
(52,222)
– change in operating liabilities
33
(43,561)
67,495
– elimination of exchange differences1
1,703
1,407
– net gain from investing activities
(433)
(117)
– contributions paid to defined benefit plans
(242)
(387)
– tax paid
(308)
(169)
Net cash (used in)/generated from operating activities
(20,743)
20,928
Cash flows from investing activities
Purchase of financial investments
(19,253)
(28,472)
Proceeds from the sale and maturity of financial investments
16,188
19,488
Purchase of property, plant and equipment
(260)
(227)
Proceeds from the sale of property, plant and equipment
401
3
Purchase of goodwill and intangible assets
(182)
(184)
Net cash outflow from acquisition of businesses and subsidiaries
(61)
(406)
Proceeds from disposal and liquidation of businesses
112
447
Net cash used in investing activities
(3,055)
(9,351)
Cash flows from financing activities
Issue of ordinary share capital
306
402
Issue of capital securities
2,196
–
Subordinated liabilities issued
–
542
Subordinated liabilities repaid
(2,203)
(542)
Net cash outflow from increase in stake of subsidiaries
(244)
(207)
Dividends paid to shareholders
(1,271)
(2,011)
Net cash used in financing activities
(1,216)
(1,816)
Net (decrease)/increase in cash and cash equivalents
(25,014)
9,761
Cash and cash equivalents at 1 January
88,017
78,661
Effect of exchange rate changes on cash and cash equivalents
(1,061)
(405)
Cash and cash equivalents at 31 December
33
61,942
88,017
1 Adjustment to bring changes between opening and closing balance sheet amounts to average rates. This is not done on a line-by-line basis, as
details cannot be determined without unreasonable expense.
The accompanying notes on pages 113 to 195 and the audited sections of the ‘Report of the Directors: Risk’ on pages 31 to 83 and the
‘Report of the Directors: Capital Management’ on pages 84 to 93 form an integral part of these financial statements.