HSBC 2014 Annual Report Download - page 16
Download and view the complete annual report
Please find page 16 of the 2014 HSBC annual report below. You can navigate through the pages in the report by either clicking on the pages listed below, or by using the keyword search tool below to find specific information within the annual report.-
 1
1 -
2
-
3
-
4
-
5
-
 6
6 -
 7
7 -
 8
8 -
 9
9 -
 10
10 -
 11
11 -
 12
12 -
 13
13 -
 14
14 -
 15
15 -
 16
16 -
 17
17 -
 18
18 -
 19
19 -
 20
20 -
 21
21 -
 22
22 -
 23
23 -
 24
24 -
 25
25 -
 26
26 -
27
-
28
-
29
-
30
-
31
-
32
-
33
-
34
-
35
-
36
-
37
-
38
-
39
-
40
-
41
-
42
-
43
-
44
-
45
-
46
-
47
-
48
-
49
-
50
-
51
-
52
-
53
-
54
-
55
-
56
-
57
-
58
-
59
-
60
-
61
-
62
-
63
-
64
-
65
-
66
-
67
-
68
-
69
-
70
-
71
-
72
-
73
-
74
-
75
-
76
-
77
-
78
-
79
-
80
-
81
-
82
-
83
-
84
-
85
-
86
-
87
-
88
-
89
-
90
-
91
-
92
-
93
-
94
-
95
-
96
-
97
-
98
-
99
-
100
-
101
-
102
-
103
-
104
-
105
-
106
-
107
-
108
-
109
-
110
-
111
-
112
-
113
-
114
-
115
-
116
-
117
-
118
-
119
-
120
-
121
-
122
-
123
-
124
-
125
-
126
-
127
-
128
-
129
-
130
-
131
-
132
-
133
-
134
-
135
-
136
-
137
-
138
-
139
-
140
-
141
-
142
-
143
-
144
-
145
-
146
-
147
-
148
-
149
-
150
-
151
-
152
-
153
-
154
-
155
-
156
-
157
-
158
-
159
-
160
-
161
-
162
-
163
-
164
-
165
-
166
-
167
-
168
-
169
-
170
-
171
-
172
-
173
-
174
-
175
-
176
-
177
-
178
-
179
-
180
-
181
-
182
-
183
-
184
-
185
-
186
-
187
-
188
-
189
-
190
-
191
-
192
-
193
-
194
-
195
-
196
-
197
-
198
-
199
-
200
 |
 |

HSBC BANK PLC
Strategic Report: Business Review (continued)
14
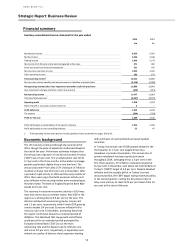
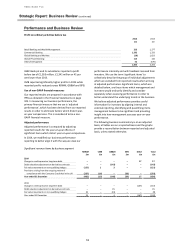
Review of business performance
HSBC Bank plc and its subsidiary undertakings reported
profit before tax of £1,953 million, £1,341 million or 41
per cent lower than 2013.
The decrease in profit before tax was primarily due to a
number of significant items including provisions arising
from the on-going review of compliance with the
Consumer Credit Act (‘CCA’) in the UK and settlements
and provisions in connection with foreign exchange
investigations. In addition, there was a reduction in
Markets revenues in GB&M and lower insurance
revenues in RBWM.
Progress continues to be made in streamlining our
processes and procedures. This is designed to reduce
complexity and lower costs in a sustainable way. Total
restructuring costs of £72 million were incurred as a
result of streamlining these businesses and other
initiatives which delivered sustainable cost savings of
approximately £312 million.
In RBWM we expanded our mortgage distribution
channels to include a specific intermediary, in order to
reach the growing proportion of the mortgage market in
the UK that wish to source its finance through
intermediaries. In France, we continued to experience
strong growth in home loans. In Turkey, the regulator
imposed interest rates caps on overdrafts and credit
cards which affected revenue.
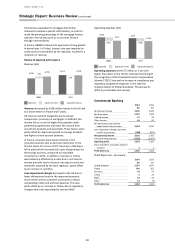
In CMB, overall UK lending, both new lending and re-
financing, continued to grow compared to 2013. In
addition, Business Banking launched a campaign to offer
further support and lending to SME customers. Lending
in Global Trade and Receivables Finance also grew. In
France, the Payments and Cash Management business
implemented the Single Euro Payments Area platform
(‘SEPA’) for euro-denominated credit transfer and direct
debit payments across European locations. In addition,
following the success of the SME fund in 2013, CMB
allocated a further fund to support customers seeking
international growth.
In GB&M, as part of the re-shaping of the business in
2013, we brought together all our financing businesses in
Capital Financing in the UK. We increased our sector
expertise and enhanced our geographic spread by
appointing two new co-heads of UK Banking. In 2014, the
advisory and equity capital markets businesses within
Capital Financing experienced volume growth that
outstripped the market. In France, GB&M acted as sole
advisor on one of the largest M&A transactions in
Europe.
GPB continued to reposition its business model and
focus its client base by reviewing portfolios and ensuring
that all clients comply with Global Standards including
financial crime compliance and tax transparency
standards.The business continued to focus on clients
with wider Group connectivity within the home and
priority markets, as well as reducing the number of
clients in non-priority markets.
Items which are significant in a comparison of 2014
results to 2013 have been summarised on pages 18 to
19.
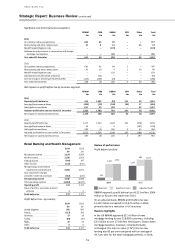
Net interest income decreased by £332 million or 5 per
cent. The decrease was primarily due to provisions of
£379 million arising from the on-going review of
compliance with the CCA in 2014. Excluding this, net
interest income increased by £47 million mainly due to
increased spreads in term lending and growth in deposit
volumes in Payments and Cash Management in the UK.
Net fee income decreased by £70 million or 2 per cent. In
RBWM the reduction in fee income in the UK was due to
a higher level of fees payable under partnership
agreements as well as lower overdrafts and investment
fees. This was partially offset by an increase in GB&M
due to lower fees paid to HSBC entities in other regions
relating to reduced Foreign Exchange trading activities
undertaken on behalf of their clients.
Trading income decreased by £764 million or 32 per
cent. The reduction includes a number of significant
items including negative fair value adjustments on non-
qualifying hedges in our French home loan portfolio in
RBWM of £155 million and an adverse movement in the
derivatives debit valuation adjustment (‘DVA’) of
£143 million in GB&M. Excluding this, net trading
revenue decreased in GB&M primarily driven by
Markets. This included the introduction of the funding
fair value adjustment (‘FFVA’) on certain derivative
contracts which resulted in a charge of £152 million
affecting Rates and Credit.
Revenues also fell in Foreign Exchange reflecting lower
volatility and reduced client flows. In addition, revenue
decreased in Equities as 2013 benefited from higher
revaluation gains, which more than offset the increase in
revenue from increased client flows and higher
derivatives income.
This decrease was partially offset by favourable foreign
exchange movements on trading assets held as
economic hedges against issued foreign currency debt
designated at fair value, compared to 2013. These offset
adverse foreign exchange movements on the foreign
currency debt reported in “Net income from financial
instruments designated at fair value”.
Net income from financial instruments designated at fair
value decreased by £529 million compared to 2013. Of
this, £296 million was due to adverse foreign exchange
movements on economically hedged foreign currency
debt in GB&M. In addition, income arising from financial
assets held to meet liabilities under insurance and
investment contracts decreased reflecting lower net
investment returns in 2014 compared to 2013. These
returns reflected weaker equity market movements in
the UK and France.
This was partially offset by favourable credit spread-
related movements in the fair value of the group’s own
long-term debt of £17 million compared to adverse fair
value movements of £167 million in 2013.
Gains less losses from financial investments increased by
£221 million, primarily due to higher net disposal gains in
the legacy portfolio partly offset by lower available-for-
sale gains in GB&M Balance Sheet Management, notably
in the UK.
Net insurance premium income decreased by £199
million or 10 per cent. This was mainly as a result of
lower volumes following the run-off of business from