HSBC 2014 Annual Report Download - page 139
Download and view the complete annual report
Please find page 139 of the 2014 HSBC annual report below. You can navigate through the pages in the report by either clicking on the pages listed below, or by using the keyword search tool below to find specific information within the annual report.-
 1
1 -
2
-
3
-
4
-
5
-
6
-
7
-
8
-
9
-
10
-
11
-
12
-
13
-
14
-
15
-
16
-
17
-
18
-
19
-
20
-
21
-
22
-
23
-
24
-
25
-
26
-
27
-
28
-
29
-
30
-
31
-
32
-
33
-
34
-
35
-
36
-
37
-
38
-
39
-
40
-
41
-
42
-
43
-
44
-
45
-
46
-
47
-
48
-
49
-
50
-
51
-
52
-
53
-
54
-
55
-
56
-
57
-
58
-
59
-
60
-
61
-
62
-
63
-
64
-
65
-
66
-
67
-
68
-
69
-
70
-
71
-
72
-
73
-
74
-
75
-
76
-
77
-
78
-
79
-
80
-
81
-
82
-
83
-
84
-
85
-
86
-
87
-
88
-
89
-
90
-
91
-
92
-
93
-
94
-
95
-
96
-
97
-
98
-
99
-
100
-
101
-
102
-
103
-
104
-
105
-
106
-
107
-
108
-
109
-
110
-
111
-
112
-
113
-
114
-
115
-
116
-
117
-
118
-
119
-
120
-
121
-
122
-
123
-
124
-
125
-
126
-
127
-
128
-
 129
129 -
 130
130 -
 131
131 -
 132
132 -
 133
133 -
 134
134 -
 135
135 -
 136
136 -
 137
137 -
 138
138 -
 139
139 -
 140
140 -
 141
141 -
 142
142 -
 143
143 -
 144
144 -
 145
145 -
 146
146 -
 147
147 -
 148
148 -
 149
149 -
150
-
151
-
152
-
153
-
154
-
155
-
156
-
157
-
158
-
159
-
160
-
161
-
162
-
163
-
164
-
165
-
166
-
167
-
168
-
169
-
170
-
171
-
172
-
173
-
174
-
175
-
176
-
177
-
178
-
179
-
180
-
181
-
182
-
183
-
184
-
185
-
186
-
187
-
188
-
189
-
190
-
191
-
192
-
193
-
194
-
195
-
196
-
197
-
198
-
199
-
200
 |
 |

HSBC BANK PLC
Notes on the Financial Statements (continued)
137
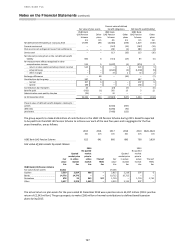
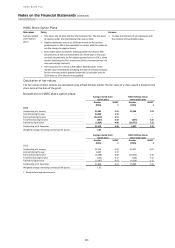
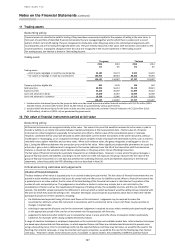
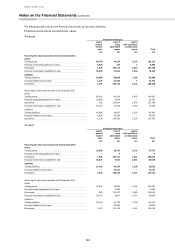
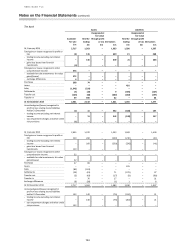
11 Trading assets
Accounting policy
Financial assets are classified as held for trading if they have been acquired principally for the purpose of selling in the near term, or
form part of a portfolio of identified financial instruments that are managed together and for which there is evidence of a recent
pattern of short-term profit-taking. They are recognised on trade date, when the group enters into contractual arrangements with
counterparties and are normally derecognised when sold. They are initially measured at fair value, with transaction costs taken to the
income statement. Subsequent changes in their fair value are recognised in the income statement in ‘Net trading income’.
For trading assets, the interest is shown in ‘Net trading income’.
Trading assets
The group
The bank
2014
2013
2014
2013
£m
£m
£m
£m
Trading assets:
– which may be repledged or resold by counterparties
24,182
53,174
9,555
31,232
– not subject to repledge or resale by counterparties
105,945
80,923
88,202
70,055
130,127
134,097
97,757
101,287
Treasury and other eligible bills
653
2,623
154
643
Debt securities
49,996
56,414
25,150
28,821
Equity securities
44,242
36,007
41,899
34,422
Loans and advances to banks
15,640
16,067
13,039
16,568
Loans and advances to customers
19,596
22,986
17,515
20,833
130,127
134,097
97,757
101,287
1 Included within the above figures for the group are debt securities issued by banks and other financial institutions of £11,278 million (2013:
£12,062 million), of which £1,857 million (2013: £2,382 million) are guaranteed by various governments.
2 Included within the above figures for the bank are debt securities issued by banks and other financial institutions of £7,228 million (2013:
£6,456 million), of which nil (2013: nil) are guaranteed by governments.
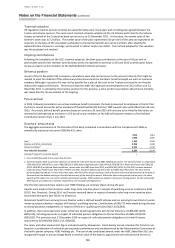
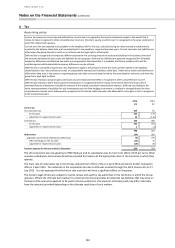
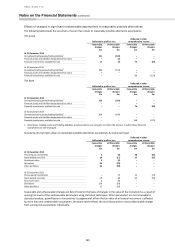
12 Fair value of financial instruments carried at fair value
Accounting policy
All financial instruments are recognised initially at fair value. Fair value is the price that would be received to sell an asset or paid to
transfer a liability in an orderly transaction between market participants at the measurement date. The fair value of a financial
instrument on initial recognition is generally its transaction price (that is, the fair value of the consideration given or received).
However, sometimes the fair value will be based on other observable current market transactions in the same instrument, without
modification or repackaging, or on a valuation technique whose variables include only data from observable markets, such as interest
rate yield curves, option volatilities and currency rates. When such evidence exists, the group recognises a trading gain or loss on
day 1, being the difference between the transaction price and the fair value. When significant unobservable parameters are used, the
entire day 1 gain or loss is deferred and is recognised in the income statement over the life of the transaction until the transaction
matures, is closed out, the valuation inputs become observable, or the group enters into an offsetting transaction.
The fair value of financial instruments is generally measured on an individual basis. However, in cases where the group manages a
group of financial assets and liabilities according to its net market or credit risk exposure, the group measures the fair value of the
group of financial instruments on a net basis but presents the underlying financial assets and liabilities separately in the financial
statements, unless they satisfy the IFRS offsetting criteria as described in Note 30.
Critical accounting estimates and judgements
Valuation of financial instruments
The best evidence of fair value is a quoted price in an actively traded principal market. The fair values of financial instruments that are
quoted in active markets are based on bid prices for assets held and offer prices for liabilities issued. Where a financial instrument has
a quoted price in an active market, the fair value of the total holding of the financial instrument is calculated as the product of the
number of units and quoted price. The judgement as to whether a market is active may include, but is not restricted to, the
consideration of factors such as the magnitude and frequency of trading activity, the availability of prices and the size of bid/offer
spreads. The bid/offer spread represents the difference in prices at which a market participant would be willing to buy compared with
the price at which they would be willing to sell. Valuation techniques may incorporate assumptions about factors that other market
participants would use in their valuations, including:
• the likelihood and expected timing of future cash flows on the instrument. Judgement may be required to assess the
counterparty’s ability to service the instrument in accordance with its contractual terms. Future cash flows may be sensitive to
changes in market rates;
• selecting an appropriate discount rate for the instrument: Judgement is required to assess what a market participant would regard
as the appropriate spread of the rate for an instrument over the appropriate risk-free rate;
• judgement to determine what model to use to calculate fair value in areas where the choice of valuation model is particularly
subjective, for example, when valuing complex derivative products.
A range of valuation techniques is employed, dependent on the instrument type and available market data. Most valuation techniques
are based upon discounted cash flow analyses, in which expected future cash flows are calculated and discounted to present value
using a discounting curve. Prior to considering credit risk, the expected future cash flows may be known, as would be the case for the
fixed leg of an interest rate swap, or may be uncertain and require projection, as would be the case for the floating leg of an interest
rate swap. ‘Projection’ utilises market forward curves, if available. In option models, the probability of different potential future