HSBC 2014 Annual Report Download - page 107
Download and view the complete annual report
Please find page 107 of the 2014 HSBC annual report below. You can navigate through the pages in the report by either clicking on the pages listed below, or by using the keyword search tool below to find specific information within the annual report.-
 1
1 -
2
-
3
-
4
-
5
-
6
-
7
-
8
-
9
-
10
-
11
-
12
-
13
-
14
-
15
-
16
-
17
-
18
-
19
-
20
-
21
-
22
-
23
-
24
-
25
-
26
-
27
-
28
-
29
-
30
-
31
-
32
-
33
-
34
-
35
-
36
-
37
-
38
-
39
-
40
-
41
-
42
-
43
-
44
-
45
-
46
-
47
-
48
-
49
-
50
-
51
-
52
-
53
-
54
-
55
-
56
-
57
-
58
-
59
-
60
-
61
-
62
-
63
-
64
-
65
-
66
-
67
-
68
-
69
-
70
-
71
-
72
-
73
-
74
-
75
-
76
-
77
-
78
-
79
-
80
-
81
-
82
-
83
-
84
-
85
-
86
-
87
-
88
-
89
-
90
-
91
-
92
-
93
-
94
-
95
-
96
-
 97
97 -
 98
98 -
 99
99 -
 100
100 -
 101
101 -
 102
102 -
 103
103 -
 104
104 -
 105
105 -
 106
106 -
 107
107 -
 108
108 -
 109
109 -
 110
110 -
 111
111 -
 112
112 -
 113
113 -
 114
114 -
 115
115 -
 116
116 -
 117
117 -
118
-
119
-
120
-
121
-
122
-
123
-
124
-
125
-
126
-
127
-
128
-
129
-
130
-
131
-
132
-
133
-
134
-
135
-
136
-
137
-
138
-
139
-
140
-
141
-
142
-
143
-
144
-
145
-
146
-
147
-
148
-
149
-
150
-
151
-
152
-
153
-
154
-
155
-
156
-
157
-
158
-
159
-
160
-
161
-
162
-
163
-
164
-
165
-
166
-
167
-
168
-
169
-
170
-
171
-
172
-
173
-
174
-
175
-
176
-
177
-
178
-
179
-
180
-
181
-
182
-
183
-
184
-
185
-
186
-
187
-
188
-
189
-
190
-
191
-
192
-
193
-
194
-
195
-
196
-
197
-
198
-
199
-
200
 |
 |

HSBC BANK PLC
Financial Statements
105
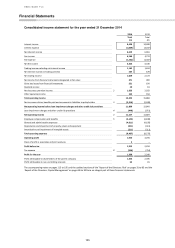
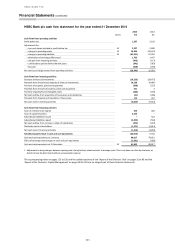
Consolidated income statement for the year ended 31 December 2014
2014
2013
Total
Total
£m
£m
Interest income
9,438
10,008
Interest expense
(2,809)
(3,047)
Net interest income
6,629
6,961
Fee income
4,568
4,723
Fee expense
(1,302)
(1,387)
Net fee income
3,266
3,336
Trading income excluding net interest income
1,142
1,694
Net interest income on trading activities
467
679
Net trading income
1,609
2,373
Net income from financial instruments designated at fair value
371
900
Gains less losses from financial investments
321
100
Dividend income
20
18
Net insurance premium income
2
1,823
2,022
Other operating income
163
158
Total operating income
14,202
15,868
Net insurance claims, benefits paid and movement in liabilities to policyholders
3
(2,316)
(3,028)
Net operating income before loan impairment charges and other credit risk provisions
11,886
12,840
4
Loan impairment charges and other credit risk provisions
4
(449)
(971)
Net operating income
4
11,437
11,869
Employee compensation and benefits
5
(4,144)
(3,838)
General and administrative expenses
(4,811)
(4,195)
Depreciation and impairment of property, plant and equipment
(321)
(331)
Amortisation and impairment of intangible assets
(211)
(211)
Total operating expenses
(9,487)
(8,575)
Operating profit
1,950
3,294
Share of profit in associates and joint ventures
3
–
Profit before tax
1,953
3,294
Tax expense
8
(564)
(754)
Profit for the year
1,389
2,540
Profit attributable to shareholders of the parent company
1,354
2,495
Profit attributable to non-controlling interests
35
45
The accompanying notes on pages 113 to 195 and the audited sections of the ‘Report of the Directors: Risk’ on pages 31 to 83 and the
‘Report of the Directors: Capital Management’ on pages 84 to 93 form an integral part of these financial statements.