GameStop 2005 Annual Report Download - page 90
Download and view the complete annual report
Please find page 90 of the 2005 GameStop annual report below. You can navigate through the pages in the report by either clicking on the pages listed below, or by using the keyword search tool below to find specific information within the annual report.-
 1
1 -
2
-
3
-
4
-
5
-
6
-
7
-
8
-
9
-
10
-
11
-
12
-
13
-
14
-
15
-
16
-
17
-
18
-
19
-
20
-
21
-
22
-
23
-
24
-
25
-
26
-
27
-
28
-
29
-
30
-
31
-
32
-
33
-
34
-
35
-
36
-
37
-
38
-
39
-
40
-
41
-
42
-
43
-
44
-
45
-
46
-
47
-
48
-
49
-
50
-
51
-
52
-
53
-
54
-
55
-
56
-
57
-
58
-
59
-
60
-
61
-
62
-
63
-
64
-
65
-
66
-
67
-
68
-
69
-
70
-
71
-
72
-
73
-
74
-
75
-
76
-
77
-
78
-
79
-
 80
80 -
 81
81 -
 82
82 -
 83
83 -
 84
84 -
 85
85 -
 86
86 -
 87
87 -
 88
88 -
 89
89 -
 90
90 -
 91
91 -
 92
92 -
 93
93 -
 94
94 -
 95
95 -
 96
96 -
 97
97 -
 98
98 -
 99
99 -
 100
100 -
101
-
102
-
103
-
104
-
105
-
106
-
107
-
108
-
109
-
110
-
111
-
112
-
113
-
114
-
115
-
116
-
117
-
118
-
119
-
120
 |
 |

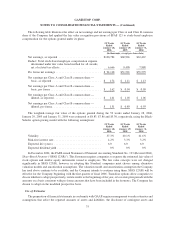
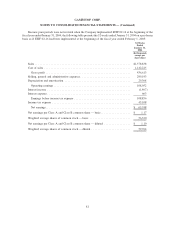
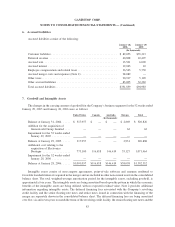
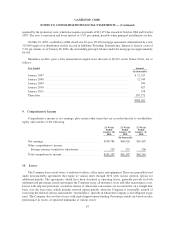
Because prior periods were not restated when the Company implemented EITF 02-16 at the beginning of the
fiscal year ended January 31, 2004, the following table presents the 52 weeks ended January 31, 2004 on a pro forma
basis as if EITF 02-16 had been implemented at the beginning of the fiscal year ended February 1, 2003:
52 Weeks
Ended
January 31,
2004
(In thousands,
except per
share data)
Sales ............................................................. $1,578,838
Cost of sales ....................................................... 1,142,225
Gross profit ...................................................... 436,613
Selling, general and administrative expenses ................................ 299,193
Depreciation and amortization .......................................... 29,368
Operating earnings ................................................. 108,052
Interest income ..................................................... (1,467)
Interest expense ..................................................... 663
Earnings before income tax expense .................................... 108,856
Income tax expense .................................................. 43,108
Net earnings...................................................... $ 65,748
Net earnings per Class A and Class B common share — basic ................... $ 1.17
Weighted average shares of common stock — basic........................... 56,330
Net earnings per Class A and Class B common share — diluted ................. $ 1.10
Weighted average shares of common stock — diluted ......................... 59,764
81
GAMESTOP CORP.
NOTES TO CONSOLIDATED FINANCIAL STATEMENTS — (Continued)