GameStop 2005 Annual Report Download - page 107
Download and view the complete annual report
Please find page 107 of the 2005 GameStop annual report below. You can navigate through the pages in the report by either clicking on the pages listed below, or by using the keyword search tool below to find specific information within the annual report.-
 1
1 -
2
-
3
-
4
-
5
-
6
-
7
-
8
-
9
-
10
-
11
-
12
-
13
-
14
-
15
-
16
-
17
-
18
-
19
-
20
-
21
-
22
-
23
-
24
-
25
-
26
-
27
-
28
-
29
-
30
-
31
-
32
-
33
-
34
-
35
-
36
-
37
-
38
-
39
-
40
-
41
-
42
-
43
-
44
-
45
-
46
-
47
-
48
-
49
-
50
-
51
-
52
-
53
-
54
-
55
-
56
-
57
-
58
-
59
-
60
-
61
-
62
-
63
-
64
-
65
-
66
-
67
-
68
-
69
-
70
-
71
-
72
-
73
-
74
-
75
-
76
-
77
-
78
-
79
-
80
-
81
-
82
-
83
-
84
-
85
-
86
-
87
-
88
-
89
-
90
-
91
-
92
-
93
-
94
-
95
-
96
-
 97
97 -
 98
98 -
 99
99 -
 100
100 -
 101
101 -
 102
102 -
 103
103 -
 104
104 -
 105
105 -
 106
106 -
 107
107 -
 108
108 -
 109
109 -
 110
110 -
 111
111 -
 112
112 -
 113
113 -
 114
114 -
 115
115 -
 116
116 -
 117
117 -
118
-
119
-
120
 |
 |

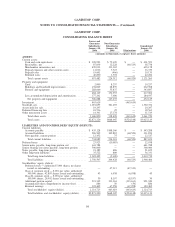
GAMESTOP CORP.
CONSOLIDATING BALANCE SHEET
Issuers and
Guarantor
Subsidiaries
January 28,
2006
Non-Guarantor
Subsidiaries
January 28,
2006 Eliminations
Consolidated
January 28,
2006
(Amounts in thousands, except per share amounts)
ASSETS:
Current assets:
Cash and cash equivalents . . . . . . . . . . . . . . . . . . . . . . $ 328,923 $ 72,670 $ — $ 401,593
Receivables, net . . . . . . . . . . . . . . . . . . . . . . . . . . . . . 87,039 12,228 (60,529) 38,738
Merchandise inventories, net. . . . . . . . . . . . . . . . . . . . . 470,013 133,165 — 603,178
Prepaid expenses and other current assets. . . . . . . . . . . . 11,016 5,323 — 16,339
Prepaid taxes . . . . . . . . . . . . . . . . . . . . . . . . . . . . . . . 19,601 (466) — 19,135
Deferred taxes . . . . . . . . . . . . . . . . . . . . . . . . . . . . . . 40,890 1,392 — 42,282
Total current assets . . . . . . . . . . . . . . . . . . . . . . . . . 957,482 224,312 (60,529) 1,121,265
Property and equipment:
Land . . . . . . . . . . . . . . . . . . . . . . . . . . . . . . . . . . . . . 2,000 8,257 — 10,257
Buildings and leasehold improvements. . . . . . . . . . . . . . 194,069 68,839 — 262,908
Fixtures and equipment . . . . . . . . . . . . . . . . . . . . . . . . 288,060 55,837 — 343,897
484,129 132,933 — 617,062
Less accumulated depreciation and amortization . . . . . . . 177,241 7,696 — 184,937
Net property and equipment . . . . . . . . . . . . . . . . . . . 306,888 125,237 — 432,125
Investment . . . . . . . . . . . . . . . . . . . . . . . . . . . . . . . . . . . 463,619 — (463,619) —
Goodwill, net . . . . . . . . . . . . . . . . . . . . . . . . . . . . . . . . . 1,091,057 301,295 — 1,392,352
Assets held for sale . . . . . . . . . . . . . . . . . . . . . . . . . . . . . 19,297 — — 19,297
Deferred financing fees . . . . . . . . . . . . . . . . . . . . . . . . . . 18,536 25 — 18,561
Other noncurrent assets . . . . . . . . . . . . . . . . . . . . . . . . . . 14,341 17,178 — 31,519
Total other assets . . . . . . . . . . . . . . . . . . . . . . . . . . . 1,606,850 318,498 (463,619) 1,461,729
Total assets . . . . . . . . . . . . . . . . . . . . . . . . . . . . . . . $2,871,220 $668,047 $(524,148) $3,015,119
LIABILITIES AND STOCKHOLDERS’ EQUITY (DEFICIT):
Current liabilities:
Accounts payable . . . . . . . . . . . . . . . . . . . . . . . . . . . . $ 435,128 $108,160 $ — $ 543,288
Accrued liabilities . . . . . . . . . . . . . . . . . . . . . . . . . . . . 286,505 105,883 (60,529) 331,859
Note payable, current portion . . . . . . . . . . . . . . . . . . . . 12,452 75 — 12,527
Total current liabilities . . . . . . . . . . . . . . . . . . . . . . . 734,085 214,118 (60,529) 887,674
Deferred taxes . . . . . . . . . . . . . . . . . . . . . . . . . . . . . . . . 23,923 (10,985) — 12,938
Senior notes payable, long-term portion, net . . . . . . . . . . . 641,788 — — 641,788
Senior floating rate notes payable, long-term portion . . . . . 300,000 — — 300,000
Notes payable, long-term portion . . . . . . . . . . . . . . . . . . . 21,189 486 — 21,675
Other long-term liabilities . . . . . . . . . . . . . . . . . . . . . . . . 35,522 809 — 36,331
Total long-term liabilities . . . . . . . . . . . . . . . . . . . . . 1,022,422 (9,690) — 1,012,732
Total liabilities . . . . . . . . . . . . . . . . . . . . . . . . . . . . 1,756,507 204,428 (60,529) 1,900,406
Stockholders’ equity (deficit):
Preferred stock — authorized 5,000 shares; no shares
issued or outstanding . . . . . . . . . . . . . . . . . . . . . . . . — 47,313 (47,313) —
Class A common stock — $.001 par value; authorized
300,000 shares; 42,895 shares issued and outstanding. . 43 6,938 (6,938) 43
Class B common stock — $.001 par value; authorized
100,000 shares; 29,902 shares issued and outstanding. . 30 8,197 (8,197) 30
Additional paid-in-capital . . . . . . . . . . . . . . . . . . . . . . . 921,349 333,163 (333,163) 921,349
Accumulated other comprehensive income (loss). . . . . . . 886 50 (50) 886
Retained earnings . . . . . . . . . . . . . . . . . . . . . . . . . . . . 192,405 67,958 (67,958) 192,405
Total stockholders’ equity (deficit) . . . . . . . . . . . . . . . 1,114,713 463,619 (463,619) 1,114,713
Total liabilities and stockholders’ equity (deficit) . . . . . $2,871,220 $668,047 $(524,148) $3,015,119
98
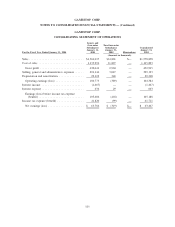
GAMESTOP CORP.
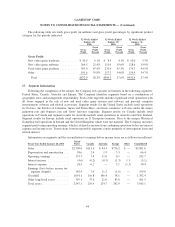
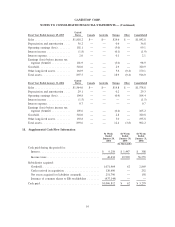
NOTES TO CONSOLIDATED FINANCIAL STATEMENTS — (Continued)