GameStop 2005 Annual Report Download - page 109
Download and view the complete annual report
Please find page 109 of the 2005 GameStop annual report below. You can navigate through the pages in the report by either clicking on the pages listed below, or by using the keyword search tool below to find specific information within the annual report.-
 1
1 -
2
-
3
-
4
-
5
-
6
-
7
-
8
-
9
-
10
-
11
-
12
-
13
-
14
-
15
-
16
-
17
-
18
-
19
-
20
-
21
-
22
-
23
-
24
-
25
-
26
-
27
-
28
-
29
-
30
-
31
-
32
-
33
-
34
-
35
-
36
-
37
-
38
-
39
-
40
-
41
-
42
-
43
-
44
-
45
-
46
-
47
-
48
-
49
-
50
-
51
-
52
-
53
-
54
-
55
-
56
-
57
-
58
-
59
-
60
-
61
-
62
-
63
-
64
-
65
-
66
-
67
-
68
-
69
-
70
-
71
-
72
-
73
-
74
-
75
-
76
-
77
-
78
-
79
-
80
-
81
-
82
-
83
-
84
-
85
-
86
-
87
-
88
-
89
-
90
-
91
-
92
-
93
-
94
-
95
-
96
-
97
-
98
-
 99
99 -
 100
100 -
 101
101 -
 102
102 -
 103
103 -
 104
104 -
 105
105 -
 106
106 -
 107
107 -
 108
108 -
 109
109 -
 110
110 -
 111
111 -
 112
112 -
 113
113 -
 114
114 -
 115
115 -
 116
116 -
 117
117 -
 118
118 -
 119
119 -
120
 |
 |

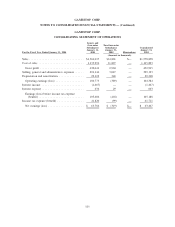
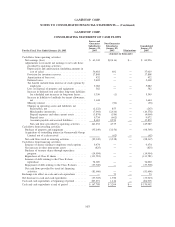
GAMESTOP CORP.
CONSOLIDATING STATEMENT OF OPERATIONS
For the Fiscal Year Ended January 28, 2006
Issuers and
Guarantor
Subsidiaries
January 28,
2006
Non-Guarantor
Subsidiaries
January 28,
2006 Eliminations
Consolidated
January 28,
2006
(Amounts in thousands)
Sales ................................... $2,709,786 $381,997 $ — $3,091,783
Cost of sales ............................. 1,927,765 291,988 — 2,219,753
Gross profit ............................ 782,021 90,009 — 872,030
Selling, general and administrative expenses ...... 536,130 63,213 — 599,343
Depreciation and amortization ................ 58,628 7,727 — 66,355
Merger-related expenses ..................... 13,600 — — 13,600
Operating earnings ....................... 173,663 19,069 — 192,732
Interest income ........................... (9,123) (1,791) 5,779 (5,135)
Interest expense ........................... 32,906 3,300 (5,779) 30,427
Merger-related interest expense ............... 7,518 7,518
Earnings (loss) before income tax expense
(benefit) ............................. 142,362 17,560 — 159,922
Income tax expense (benefit) . ................ 50,872 8,266 — 59,138
Net earnings (loss) ....................... $ 91,490 $ 9,294 $ — $ 100,784
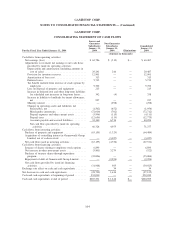
GAMESTOP CORP.
CONSOLIDATING STATEMENT OF OPERATIONS
For the Fiscal Year Ended January 29, 2005
Issuers and
Guarantor
Subsidiaries
January 29,
2005
Non-Guarantor
Subsidiaries
January 29,
2005 Eliminations
Consolidated
January 29,
2005
(Amounts in thousands)
Sales ................................... $1,818,158 $24,648 $— $1,842,806
Cost of sales ............................. 1,314,937 18,569 — 1,333,506
Gross profit ............................ 503,221 6,079 — 509,300
Selling, general and administrative expenses ...... 364,903 8,461 — 373,364
Depreciation and amortization ................ 36,187 602 — 36,789
Operating earnings (loss) . . ................ 102,131 (2,984) — 99,147
Interest income ........................... (1,854) (65) — (1,919)
Interest expense ........................... 2,024 131 — 2,155
Earnings (loss) before income tax expense
(benefit) ............................. 101,961 (3,050) — 98,911
Income tax expense (benefit) . ................ 38,619 (634) — 37,985
Net earnings (loss) ....................... $ 63,342 $ (2,416) $— $ 60,926
100
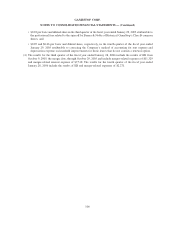
GAMESTOP CORP.
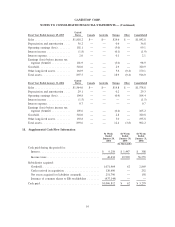
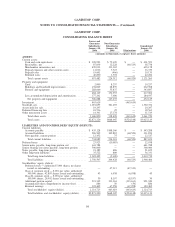
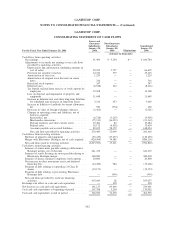
NOTES TO CONSOLIDATED FINANCIAL STATEMENTS — (Continued)