GameStop 2005 Annual Report Download - page 84
Download and view the complete annual report
Please find page 84 of the 2005 GameStop annual report below. You can navigate through the pages in the report by either clicking on the pages listed below, or by using the keyword search tool below to find specific information within the annual report.-
 1
1 -
2
-
3
-
4
-
5
-
6
-
7
-
8
-
9
-
10
-
11
-
12
-
13
-
14
-
15
-
16
-
17
-
18
-
19
-
20
-
21
-
22
-
23
-
24
-
25
-
26
-
27
-
28
-
29
-
30
-
31
-
32
-
33
-
34
-
35
-
36
-
37
-
38
-
39
-
40
-
41
-
42
-
43
-
44
-
45
-
46
-
47
-
48
-
49
-
50
-
51
-
52
-
53
-
54
-
55
-
56
-
57
-
58
-
59
-
60
-
61
-
62
-
63
-
64
-
65
-
66
-
67
-
68
-
69
-
70
-
71
-
72
-
73
-
 74
74 -
 75
75 -
 76
76 -
 77
77 -
 78
78 -
 79
79 -
 80
80 -
 81
81 -
 82
82 -
 83
83 -
 84
84 -
 85
85 -
 86
86 -
 87
87 -
 88
88 -
 89
89 -
 90
90 -
 91
91 -
 92
92 -
 93
93 -
 94
94 -
95
-
96
-
97
-
98
-
99
-
100
-
101
-
102
-
103
-
104
-
105
-
106
-
107
-
108
-
109
-
110
-
111
-
112
-
113
-
114
-
115
-
116
-
117
-
118
-
119
-
120
 |
 |

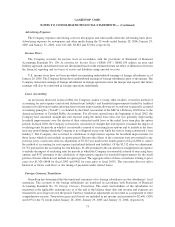
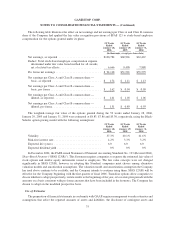
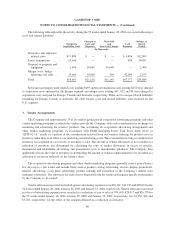
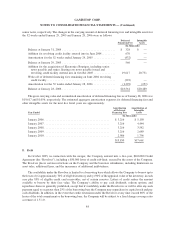
The following table illustrates the effect on net earnings and net earnings per Class A and Class B common
share if the Company had applied the fair value recognition provisions of SFAS 123 to stock-based employee
compensation for the options granted under its plans:
52 Weeks
Ended
January 28,
2006
52 Weeks
Ended
January 29,
2005
52 Weeks
Ended
January 31,
2004
(In thousands, except per share data)
Net earnings, as reported ........................... $100,784 $60,926 $63,467
Deduct: Total stock-based employee compensation expense
determined under fair value based method for all awards,
net of related tax effects .......................... 6,666 9,405 7,888
Pro forma net earnings ............................. $ 94,118 $51,521 $55,579
Net earnings per Class A and Class B common share —
basic, as reported ............................... $ 1.74 $ 1.11 $ 1.13
Net earnings per Class A and Class B common share —
basic, pro forma ................................ $ 1.62 $ 0.94 $ 0.99
Net earnings per Class A and Class B common share —
diluted, as reported .............................. $ 1.61 $ 1.05 $ 1.06
Net earnings per Class A and Class B common share —
diluted, pro forma ............................... $ 1.51 $ 0.89 $ 0.93
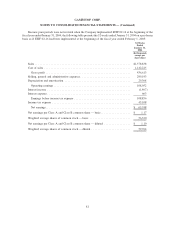
The weighted-average fair value of the options granted during the 52 weeks ended January 28, 2006,
January 29, 2005 and January 31, 2004 were estimated at $8.83, $7.86 and $5.30, respectively, using the Black-
Scholes option pricing model with the following assumptions:
52 Weeks
Ended
January 28,
2006
52 Weeks
Ended
January 29,
2005
52 Weeks
Ended
January 31,
2004
Volatility ....................................... 57.3% 60.1% 61.6%
Risk-free interest rate .............................. 4.2% 3.3% 3.2%
Expected life (years)............................... 6.0 6.0 6.0
Expected dividend yield ............................ 0% 0% 0%
In December 2004, the FASB issued Statement of Financial Accounting Standards No. 123 (Revised 2004),
Share-Based Payment (“SFAS 123(R)”). This Statement requires companies to expense the estimated fair value of
stock options and similar equity instruments issued to employees. The fair value concepts were not changed
significantly in SFAS 123(R), however, in adopting this Standard, companies must choose among alternative
valuation models and amortization assumptions. The valuation model and amortization assumption the Company
has used above continue to be available, and the Company intends to continue using them. SFAS 123(R) will be
effective for the Company beginning with the first quarter of fiscal 2006. Transition options allow companies to
choose whether to adopt prospectively, restate results to the beginning of the year, or to restate prior periods with the
amounts on a basis consistent with pro forma amounts that have been included in the footnotes. The Company has
chosen to adopt on the modified prospective basis.
Use of Estimates
The preparation of financial statements in conformity with GAAP requires management to make estimates and
assumptions that affect the reported amounts of assets and liabilities, the disclosure of contingent assets and
75
GAMESTOP CORP.
NOTES TO CONSOLIDATED FINANCIAL STATEMENTS — (Continued)