GameStop 2005 Annual Report Download - page 36
Download and view the complete annual report
Please find page 36 of the 2005 GameStop annual report below. You can navigate through the pages in the report by either clicking on the pages listed below, or by using the keyword search tool below to find specific information within the annual report.-
 1
1 -
2
-
3
-
4
-
5
-
6
-
7
-
8
-
9
-
10
-
11
-
12
-
13
-
14
-
15
-
16
-
17
-
18
-
19
-
20
-
21
-
22
-
23
-
24
-
25
-
 26
26 -
 27
27 -
 28
28 -
 29
29 -
 30
30 -
 31
31 -
 32
32 -
 33
33 -
 34
34 -
 35
35 -
 36
36 -
 37
37 -
 38
38 -
 39
39 -
 40
40 -
 41
41 -
 42
42 -
 43
43 -
 44
44 -
 45
45 -
 46
46 -
47
-
48
-
49
-
50
-
51
-
52
-
53
-
54
-
55
-
56
-
57
-
58
-
59
-
60
-
61
-
62
-
63
-
64
-
65
-
66
-
67
-
68
-
69
-
70
-
71
-
72
-
73
-
74
-
75
-
76
-
77
-
78
-
79
-
80
-
81
-
82
-
83
-
84
-
85
-
86
-
87
-
88
-
89
-
90
-
91
-
92
-
93
-
94
-
95
-
96
-
97
-
98
-
99
-
100
-
101
-
102
-
103
-
104
-
105
-
106
-
107
-
108
-
109
-
110
-
111
-
112
-
113
-
114
-
115
-
116
-
117
-
118
-
119
-
120
 |
 |
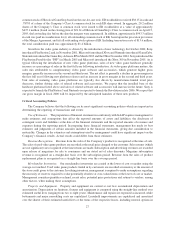
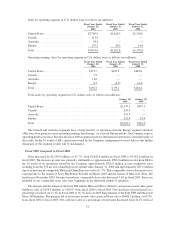
common stock of Historical GameStop based on the one-for-one ratio. EB stockholders received $38.15 in cash and
.78795 of a share of the Company’s Class A common stock for each EB share owned. In aggregate, 20.2 million
shares of the Company’s Class A common stock were issued to EB stockholders at a value of approximately
$437.1 million (based on the closing price of $21.61 of Historical GameStop’s Class A common stock on April 15,
2005, the last trading day before the date the mergers were announced). In addition, approximately $993.3 million
in cash was paid in consideration for (i) all outstanding common stock of EB, based upon the pro-ration provisions
of the Merger Agreement, and (ii) all outstanding stock options of EB. Including transaction costs of $13.6 million,
the total consideration paid was approximately $1.4 billion.
Growth in the video game industry is driven by the introduction of new technology. In October 2000, Sony
introduced PlayStation 2 and, in November 2001, Microsoft introduced Xbox and Nintendo introduced GameCube.
Nintendo introduced the Game Boy Advance SP in March 2003 and the DS in November 2004. Sony introduced the
PlayStation Portable (the “PSP”) in March 2005 and Microsoft introduced the Xbox 360 in November 2005. As is
typical following the introduction of new video game platforms, sales of new video game hardware generally
increase as a percentage of sales in the first full year following introduction. As video game platforms mature, the
sales mix attributable to complementary video game software and accessories, which generate higher gross
margins, generally increases in the second and third years. The net effect is generally a decline in gross margins in
the first full year following new platform releases and an increase in gross margins in the second and third years.
Unit sales of maturing video game platforms are typically also driven by manufacturer-funded retail price
decreases, further driving sales of related software and accessories. We expect that the installed base of the
hardware platforms listed above and sales of related software and accessories will increase in the future. Sony is
expected to launch the PlayStation 3 and Nintendo is expected to launch the Revolution in late 2006. We expect that
our gross margin in fiscal 2006 will be impacted by the anticipated launches of these new products.
Critical Accounting Policies
The Company believes that the following are its most significant accounting policies which are important in
determining the reporting of transactions and events:
Use of Estimates. The preparation of financial statements in conformity with GAAP requires management to
make estimates and assumptions that affect the reported amounts of assets and liabilities, the disclosure of
contingent assets and liabilities at the date of the financial statements and the reported amounts of revenues and
expenses during the reporting period. In preparing these financial statements, management has made its best
estimates and judgments of certain amounts included in the financial statements, giving due consideration to
materiality. Changes in the estimates and assumptions used by management could have significant impact on the
Company’s financial results. Actual results could differ from those estimates.
Revenue Recognition. Revenue from the sales of the Company’s products is recognized at the time of sale.
The sales of used video game products are recorded at the retail price charged to the customer. Sales returns (which
are not significant) are recognized at the time returns are made. Subscription and advertising revenues are recorded
upon release of magazines for sale to consumers and are stated net of sales discounts. Magazine subscription
revenue is recognized on a straight-line basis over the subscription period. Revenue from the sales of product
replacement plans is recognized on a straight-line basis over the coverage period.
Merchandise Inventories. Our merchandise inventories are carried at the lower of cost or market using the
average cost method. Used video game products traded in by customers are recorded as inventory at the amount of
the store credit given to the customer. In valuing inventory, management is required to make assumptions regarding
the necessity of reserves required to value potentially obsolete or over-valued items at the lower of cost or market.
Management considers quantities on hand, recent sales, potential price protections and returns to vendors, among
other factors, when making these assumptions.
Property and Equipment. Property and equipment are carried at cost less accumulated depreciation and
amortization. Depreciation on furniture, fixtures and equipment is computed using the straight-line method over
estimated useful lives (ranging from two to eight years). Maintenance and repairs are expensed as incurred, while
betterments and major remodeling costs are capitalized. Leasehold improvements are capitalized and amortized
over the shorter of their estimated useful lives or the terms of the respective leases, including renewal options in
27