GameStop 2005 Annual Report Download - page 111
Download and view the complete annual report
Please find page 111 of the 2005 GameStop annual report below. You can navigate through the pages in the report by either clicking on the pages listed below, or by using the keyword search tool below to find specific information within the annual report.-
 1
1 -
2
-
3
-
4
-
5
-
6
-
7
-
8
-
9
-
10
-
11
-
12
-
13
-
14
-
15
-
16
-
17
-
18
-
19
-
20
-
21
-
22
-
23
-
24
-
25
-
26
-
27
-
28
-
29
-
30
-
31
-
32
-
33
-
34
-
35
-
36
-
37
-
38
-
39
-
40
-
41
-
42
-
43
-
44
-
45
-
46
-
47
-
48
-
49
-
50
-
51
-
52
-
53
-
54
-
55
-
56
-
57
-
58
-
59
-
60
-
61
-
62
-
63
-
64
-
65
-
66
-
67
-
68
-
69
-
70
-
71
-
72
-
73
-
74
-
75
-
76
-
77
-
78
-
79
-
80
-
81
-
82
-
83
-
84
-
85
-
86
-
87
-
88
-
89
-
90
-
91
-
92
-
93
-
94
-
95
-
96
-
97
-
98
-
99
-
100
-
 101
101 -
 102
102 -
 103
103 -
 104
104 -
 105
105 -
 106
106 -
 107
107 -
 108
108 -
 109
109 -
 110
110 -
 111
111 -
 112
112 -
 113
113 -
 114
114 -
 115
115 -
 116
116 -
 117
117 -
 118
118 -
 119
119 -
 120
120
 |
 |

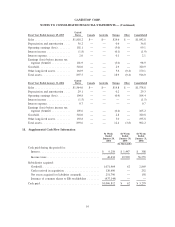
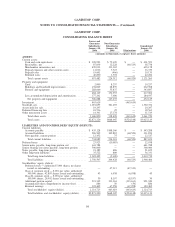
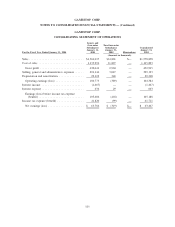
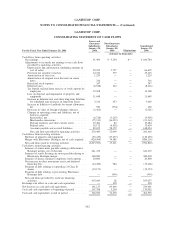
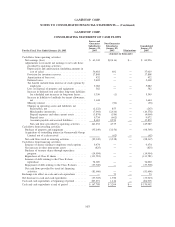
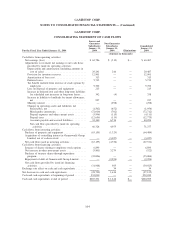
GAMESTOP CORP.
CONSOLIDATING STATEMENT OF CASH FLOWS
For the Fiscal Year Ended January 28, 2006
Issuers and
Guarantor
Subsidiaries
January 28,
2006
Non-Guarantor
Subsidiaries
January 28,
2006 Eliminations
Consolidated
January 28,
2006
(Amounts in thousands)
Cash flows from operating activities:
Net earnings . . . . . . . . . . . . . . . . . . . . . . . . . . . . . . . . 91,490 $ 9,294 $— $ 100,784
Adjustments to reconcile net earnings to net cash flows
provided by operating activities:
Depreciation and amortization (including amounts in
cost of sales) . . . . . . . . . . . . . . . . . . . . . . . . . . . . 58,932 7,727 — 66,659
Provision for inventory reserves. . . . . . . . . . . . . . . . . 24,726 377 — 25,103
Amortization of loan cost . . . . . . . . . . . . . . . . . . . . . 1,229 — — 1,229
Amortization of original issue discount on senior
notes. . . . . . . . . . . . . . . . . . . . . . . . . . . . . . . . . . 316 — — 316
Restricted stock expense . . . . . . . . . . . . . . . . . . . . . . 347 — — 347
Deferred taxes . . . . . . . . . . . . . . . . . . . . . . . . . . . . . (8,528) 312 — (8,216)
Tax benefit realized from exercise of stock options by
employees . . . . . . . . . . . . . . . . . . . . . . . . . . . . . . 12,308 — — 12,308
Loss on disposal and impairment of property and
equipment . . . . . . . . . . . . . . . . . . . . . . . . . . . . . . 11,648 — — 11,648
Increase in deferred rent and other long-term liabilities
for scheduled rent increases in long-term leases . . . . 3,216 453 — 3,669
Increase in liability to landlords for tenant allowances,
net . . . . . . . . . . . . . . . . . . . . . . . . . . . . . . . . . . . 936 (734) — 202
Decrease in value of foreign exchange contracts . . . . . (2,421) — — (2,421)
Changes in operating assets and liabilities, net of
business acquired
Receivables, net . . . . . . . . . . . . . . . . . . . . . . . . . . (6,728) (3,267) — (9,995)
Merchandise inventories . . . . . . . . . . . . . . . . . . . . (75,311) (16,052) — (91,363)
Prepaid expenses and other current assets . . . . . . . . 19,402 82 — 19,484
Prepaid taxes . . . . . . . . . . . . . . . . . . . . . . . . . . . . 18,172 (4,562) — 13,610
Accounts payable and accrued liabilities . . . . . . . . . 89,675 58,379 — 148,054
Net cash flows provided by operating activities . . . . 239,409 52,009 — 291,418
Cash flows from investing activities:
Purchase of property and equipment . . . . . . . . . . . . . . . (93,419) (17,277) — (110,696)
Merger with Electronics Boutique, net of cash acquired . . (920,504) 34,388 — (886,116)
Net cash flows used in investing activities . . . . . . . . . . . (1,013,923) 17,111 — (996,812)
Cash flows from financing activities:
Issuance of senior notes payable relating to Electronics
Boutique merger, net of discount . . . . . . . . . . . . . . . . 641,472 — — 641,472
Issuance of senior floating rate notes payable relating to
Electronics Boutique merger . . . . . . . . . . . . . . . . . . . 300,000 — — 300,000
Issuance of shares relating to employee stock options . . . 20,800 — — 20,800
Net increase in other noncurrent assets and deferred
financing fees . . . . . . . . . . . . . . . . . . . . . . . . . . . . . (14,450) 984 — (13,466)
Payment of debt relating to repurchase of Class B
shares . . . . . . . . . . . . . . . . . . . . . . . . . . . . . . . . . . . (12,173) — — (12,173)
Payment of debt relating to pre-existing Electronics
Boutique debt . . . . . . . . . . . . . . . . . . . . . . . . . . . . . — (956) — (956)
Net cash flows provided by (used in) financing
activities . . . . . . . . . . . . . . . . . . . . . . . . . . . . . . . . . 935,649 28 — 935,677
Exchange rate effect on cash and cash equivalents . . . . . . . — 318 — 318
Net decrease in cash and cash equivalents . . . . . . . . . . . . . 161,135 69,466 — 230,601
Cash and cash equivalents at beginning of period . . . . . . . . 167,788 3,204 — 170,992
Cash and cash equivalents at end of period . . . . . . . . . . . . 328,923 72,670 — 401,593
102
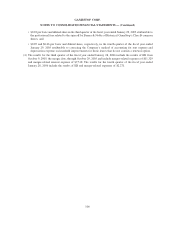
GAMESTOP CORP.
NOTES TO CONSOLIDATED FINANCIAL STATEMENTS — (Continued)