GameStop 2005 Annual Report Download - page 112
Download and view the complete annual report
Please find page 112 of the 2005 GameStop annual report below. You can navigate through the pages in the report by either clicking on the pages listed below, or by using the keyword search tool below to find specific information within the annual report.-
 1
1 -
2
-
3
-
4
-
5
-
6
-
7
-
8
-
9
-
10
-
11
-
12
-
13
-
14
-
15
-
16
-
17
-
18
-
19
-
20
-
21
-
22
-
23
-
24
-
25
-
26
-
27
-
28
-
29
-
30
-
31
-
32
-
33
-
34
-
35
-
36
-
37
-
38
-
39
-
40
-
41
-
42
-
43
-
44
-
45
-
46
-
47
-
48
-
49
-
50
-
51
-
52
-
53
-
54
-
55
-
56
-
57
-
58
-
59
-
60
-
61
-
62
-
63
-
64
-
65
-
66
-
67
-
68
-
69
-
70
-
71
-
72
-
73
-
74
-
75
-
76
-
77
-
78
-
79
-
80
-
81
-
82
-
83
-
84
-
85
-
86
-
87
-
88
-
89
-
90
-
91
-
92
-
93
-
94
-
95
-
96
-
97
-
98
-
99
-
100
-
101
-
 102
102 -
 103
103 -
 104
104 -
 105
105 -
 106
106 -
 107
107 -
 108
108 -
 109
109 -
 110
110 -
 111
111 -
 112
112 -
 113
113 -
 114
114 -
 115
115 -
 116
116 -
 117
117 -
 118
118 -
 119
119 -
 120
120
 |
 |

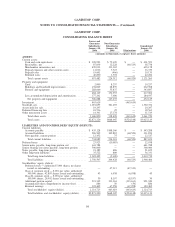
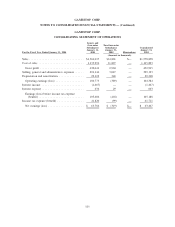
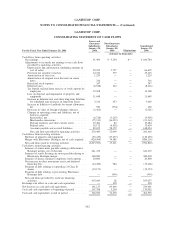
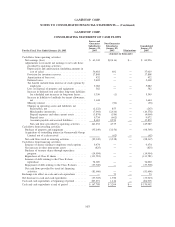
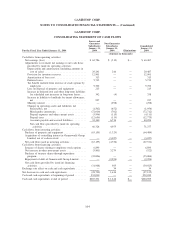
GAMESTOP CORP.
CONSOLIDATING STATEMENT OF CASH FLOWS
For the Fiscal Year Ended January 29, 2005
Issuers and
Guarantor
Subsidiaries
January 29,
2005
Non-Guarantor
Subsidiaries
January 29,
2005 Eliminations
Consolidated
January 29,
2005
(Amounts in thousands)
Cash flows from operating activities:
Net earnings (loss) . . . . . . . . . . . . . . . . . . . . . . . . . . . $ 63,342 $(2,416) $— $ 60,926
Adjustments to reconcile net earnings to net cash flows
provided by operating activities:
Depreciation and amortization (including amounts in
cost of sales) . . . . . . . . . . . . . . . . . . . . . . . . . . . . 36,418 601 — 37,019
Provision for inventory reserves. . . . . . . . . . . . . . . . . 17,808 — — 17,808
Amortization of loan cost . . . . . . . . . . . . . . . . . . . . . 432 — — 432
Deferred taxes . . . . . . . . . . . . . . . . . . . . . . . . . . . . . 5,402 — — 5,402
Tax benefit realized from exercise of stock options by
employees . . . . . . . . . . . . . . . . . . . . . . . . . . . . . . 5,082 — — 5,082
Loss on disposal of property and equipment . . . . . . . . 382 — — 382
Increase in deferred rent and other long-term liabilities
for scheduled rent increases in long-term leases . . . . 5,350 (1) — 5,349
Increase in liability to landlords for tenant allowances,
net . . . . . . . . . . . . . . . . . . . . . . . . . . . . . . . . . . . 1,644 — 1,644
Minority interest . . . . . . . . . . . . . . . . . . . . . . . . . . . — (96) — (96)
Changes in operating assets and liabilities, net
Receivables, net . . . . . . . . . . . . . . . . . . . . . . . . . . (1,122) 855 — (267)
Merchandise inventories . . . . . . . . . . . . . . . . . . . . (7,964) (2,614) — (10,578)
Prepaid expenses and other current assets . . . . . . . . (3,874) (186) — (4,060)
Prepaid taxes . . . . . . . . . . . . . . . . . . . . . . . . . . . . 9,734 (662) — 9,072
Accounts payable and accrued liabilities . . . . . . . . . 8,618 9,254 — 17,872
Net cash flows provided by operating activities . . . . 141,252 4,735 — 145,987
Cash flows from investing activities:
Purchase of property and equipment . . . . . . . . . . . . . . . (95,149) (3,156) — (98,305)
Acquisition of controlling interest in Gamesworld Group
Limited, net of cash received . . . . . . . . . . . . . . . . . . (62) — (62)
Net cash flows used in investing activities . . . . . . . . . . . (95,149) (3,218) — (98,367)
Cash flows from financing activities:
Issuance of shares relating to employee stock options . . . 9,474 — — 9,474
Net increase in other noncurrent assets . . . . . . . . . . . . . (825) — — (825)
Purchase of treasury shares through repurchase
program . . . . . . . . . . . . . . . . . . . . . . . . . . . . . . . . . (14,994) — — (14,994)
Repurchase of Class B shares . . . . . . . . . . . . . . . . . . . . (111,781) — — (111,781)
Issuance of debt relating to the Class B share
repurchase . . . . . . . . . . . . . . . . . . . . . . . . . . . . . . . 74,020 — — 74,020
Repayment of debt relating to the Class B shares . . . . . . (37,500) — — (37,500)
Net cash flows provided by (used in) financing
activities . . . . . . . . . . . . . . . . . . . . . . . . . . . . . . . . . (81,606) — — (81,606)
Exchange rate effect on cash and cash equivalents . . . . . . . — 73 — 73
Net decrease in cash and cash equivalents . . . . . . . . . . . . . (35,503) 1,590 — (33,913)
Cash and cash equivalents at beginning of period . . . . . . . . 203,291 1,614 — 204,905
Cash and cash equivalents at end of period . . . . . . . . . . . . $ 167,788 $ 3,204 $— $ 170,992
103
GAMESTOP CORP.
NOTES TO CONSOLIDATED FINANCIAL STATEMENTS — (Continued)