GameStop 2005 Annual Report Download - page 34
Download and view the complete annual report
Please find page 34 of the 2005 GameStop annual report below. You can navigate through the pages in the report by either clicking on the pages listed below, or by using the keyword search tool below to find specific information within the annual report.-
 1
1 -
2
-
3
-
4
-
5
-
6
-
7
-
8
-
9
-
10
-
11
-
12
-
13
-
14
-
15
-
16
-
17
-
18
-
19
-
20
-
21
-
22
-
23
-
 24
24 -
 25
25 -
 26
26 -
 27
27 -
 28
28 -
 29
29 -
 30
30 -
 31
31 -
 32
32 -
 33
33 -
 34
34 -
 35
35 -
 36
36 -
 37
37 -
 38
38 -
 39
39 -
 40
40 -
 41
41 -
 42
42 -
 43
43 -
 44
44 -
45
-
46
-
47
-
48
-
49
-
50
-
51
-
52
-
53
-
54
-
55
-
56
-
57
-
58
-
59
-
60
-
61
-
62
-
63
-
64
-
65
-
66
-
67
-
68
-
69
-
70
-
71
-
72
-
73
-
74
-
75
-
76
-
77
-
78
-
79
-
80
-
81
-
82
-
83
-
84
-
85
-
86
-
87
-
88
-
89
-
90
-
91
-
92
-
93
-
94
-
95
-
96
-
97
-
98
-
99
-
100
-
101
-
102
-
103
-
104
-
105
-
106
-
107
-
108
-
109
-
110
-
111
-
112
-
113
-
114
-
115
-
116
-
117
-
118
-
119
-
120
 |
 |

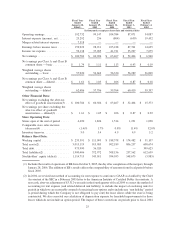
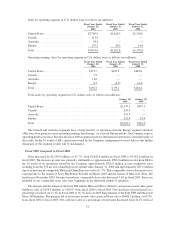
Fiscal Year
Ended
January 28,
2006(1)
Fiscal Year
Ended
January 29,
2005
Fiscal Year
Ended
January 31,
2004
Fiscal Year
Ended
February 1,
2003
Fiscal Year
Ended
February 2,
2002
In thousands, except per share data and statistical data
Operating earnings ............... 192,732 99,147 104,384 87,071 34,087
Interest expense (income), net ....... 25,292 236 (804) (630) 19,452
Merger-related interest expense ...... 7,518 — — — —
Earnings before income taxes ....... 159,922 98,911 105,188 87,701 14,635
Income tax expense............... 59,138 37,985 41,721 35,297 7,675
Net earnings .................... $ 100,784 $ 60,926 $ 63,467 $ 52,404 $ 6,960
Net earnings per Class A and Class B
common share — basic .......... $ 1.74 $ 1.11 $ 1.13 $ 0.93 $ 0.19
Weighted average shares
outstanding — basic . ........... 57,920 54,662 56,330 56,289 36,009
Net earnings per Class A and Class B
common share — diluted ......... $ 1.61 $ 1.05 $ 1.06 $ 0.87 $ 0.18
Weighted average shares
outstanding — diluted ........... 62,486 57,796 59,764 60,419 39,397
Other Financial Data:
Net earnings excluding the after-tax
effect of goodwill amortization(3) . . $ 100,784 $ 60,926 $ 63,467 $ 52,404 $ 15,373
Net earnings per share excluding the
after-tax effect of goodwill
amortization — diluted(3) ........ $ 1.61 $ 1.05 $ 1.06 $ 0.87 $ 0.39
Store Operating Data:
Stores open at the end of period ..... 4,490 1,826 1,514 1,231 1,038
Comparable store sales increase
(decrease)(4) .................. (1.4)% 1.7% 0.8% 11.4% 32.0%
Inventory turnover................ 5.0 5.4 4.9 4.9 5.2
Balance Sheet Data:
Working capital ................. $ 233,591 $ 111,093 $ 188,378 $ 174,482 $ 31,107
Total assets(2)................... 3,015,119 915,983 902,189 806,237 608,674
Total debt ...................... 975,990 36,520 — — 399,623
Total liabilities(2) ................ 1,900,406 372,972 308,156 257,562 612,659
Stockholders’ equity (deficit)........ 1,114,713 543,011 594,033 548,675 (3,985)
(1) Includes the results of operations of EB from October 9, 2005, the day after completion of the mergers, through
January 28, 2006. The addition of EB’s results affects the comparability of amounts from fiscal periods before
fiscal 2005.
(2) In 2004, we revised our method of accounting for rent expense to conform to GAAP, as clarified by the Chief
Accountant of the SEC in a February 2005 letter to the American Institute of Certified Public Accountants. A
non-cash, after-tax adjustment of $3,312 was made in the fourth quarter of fiscal 2004 to correct the method of
accounting for rent expense (and related deferred rent liability) to include the impact of escalating rents for
periods in which we are reasonably assured of exercising lease options and to include any “rent holiday” period
(a period during which the Company is not obligated to pay rent) the lease allows while the store is being
constructed. We also corrected our calculation of depreciation expense for leasehold improvements for those
leases which do not include an option period. The impact of these corrections on periods prior to fiscal 2004
25