GameStop 2005 Annual Report Download - page 42
Download and view the complete annual report
Please find page 42 of the 2005 GameStop annual report below. You can navigate through the pages in the report by either clicking on the pages listed below, or by using the keyword search tool below to find specific information within the annual report.-
 1
1 -
2
-
3
-
4
-
5
-
6
-
7
-
8
-
9
-
10
-
11
-
12
-
13
-
14
-
15
-
16
-
17
-
18
-
19
-
20
-
21
-
22
-
23
-
24
-
25
-
26
-
27
-
28
-
29
-
30
-
31
-
 32
32 -
 33
33 -
 34
34 -
 35
35 -
 36
36 -
 37
37 -
 38
38 -
 39
39 -
 40
40 -
 41
41 -
 42
42 -
 43
43 -
 44
44 -
 45
45 -
 46
46 -
 47
47 -
 48
48 -
 49
49 -
 50
50 -
 51
51 -
 52
52 -
53
-
54
-
55
-
56
-
57
-
58
-
59
-
60
-
61
-
62
-
63
-
64
-
65
-
66
-
67
-
68
-
69
-
70
-
71
-
72
-
73
-
74
-
75
-
76
-
77
-
78
-
79
-
80
-
81
-
82
-
83
-
84
-
85
-
86
-
87
-
88
-
89
-
90
-
91
-
92
-
93
-
94
-
95
-
96
-
97
-
98
-
99
-
100
-
101
-
102
-
103
-
104
-
105
-
106
-
107
-
108
-
109
-
110
-
111
-
112
-
113
-
114
-
115
-
116
-
117
-
118
-
119
-
120
 |
 |
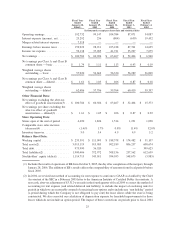
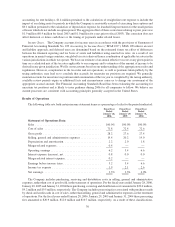
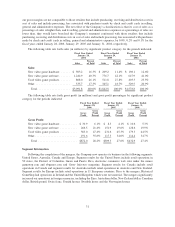
2004 to 40.3% in fiscal 2005, due to the increase in new hardware sales as a percentage of total sales. Used video
game product sales also grew due to an increase in store count, efforts to increase the supply of used inventory
available for sale and the mergers, with an increase in sales of $296.2 million, or 57.9%, from fiscal 2004. Sales of
other product categories, including PC entertainment and other software and accessories, magazines and character-
related merchandise, grew 55.2%, or $190.6 million, from fiscal 2004 to fiscal 2005, due to the mergers.
Cost of sales increased by $886.3 million, or 66.5%, from $1,333.5 million in fiscal 2004 to $2,219.8 million in
fiscal 2005 as a result of the changes in gross profit discussed below.
Gross profit increased by $362.7 million, or 71.2%, from $509.3 million in fiscal 2004 to $872.0 million in
fiscal 2005. Gross profit as a percentage of sales increased from 27.6% in fiscal 2004 to 28.2% in fiscal 2005. This
increase was primarily the result of increases in vendor allowances received in excess of advertising expenses,
which are recorded as a reduction in cost of sales. In fiscal 2005, vendor allowances received in excess of
advertising expenses were $74.7 million compared to $29.9 million in fiscal 2004. This increase was due to the
ownership of EB during the fourth fiscal quarter, during which much of the year’s advertising allowances are
generated, and due to the launch of the Xbox 360, which generated additional advertising allowances. Gross profit
as a percentage of sales on new hardware, new software and other products increased due to the increase in vendor
allowances received as discussed above. The gross profit on new hardware increased from 4.1% of sales in fiscal
2004 to 6.1% in fiscal 2005. Because new hardware platforms typically have lower margins than established
hardware platforms, as expected, the launch of the Sony PSP and the Microsoft Xbox 360 had an offsetting effect on
new hardware gross profit as a percentage of sales. Gross profit as a percentage of sales on new software increased
from 19.6% in fiscal 2004 to 21.4% in fiscal 2005 due to the increase in vendor allowances received, as discussed
above. Gross profit as a percentage of sales on other products increased from 34.0% in fiscal 2004 to 35.8% in fiscal
2005. Gross profit as a percentage of sales on used video game products increased from 45.3% in fiscal 2004 to
47.4% in fiscal 2005 due to increased efforts to monitor margin rates and, following the mergers, the application of
GameStop’s merchandising algorithms to EB’s used video game category.
The Company expects gross profit as a percentage of sales in fiscal 2006 to be impacted by the anticipated
launch in late 2006 of two new hardware platforms in the United States and the March 2006 launch of Microsoft’s
Xbox 360 hardware platform in Australia.
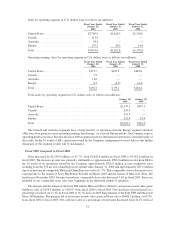
Selling, general and administrative expenses increased by $225.9 million, or 60.5%, from $373.4 million in
fiscal 2004 to $599.3 million in fiscal 2005. Approximately $165.9 million of this increase was attributable to the
mergers and the remainder was due to increases in the number of stores in operation, and the related increases in
store, distribution, and corporate office operating expenses. Selling, general and administrative expenses as a
percentage of sales decreased from 20.2% in fiscal 2004 to 19.4% in fiscal 2005. The decrease in selling, general
and administrative expenses as a percentage of sales was primarily due to combining the full year results of
Historical GameStop’s operations with the 16 weeks of EB’s operations, including the fourth quarter of the fiscal
year. The fourth quarter of the fiscal year typically experiences high leveraging of selling, general and admin-
istrative expenses due to the holiday selling season. Foreign currency transaction gains and (losses) are included in
selling, general and administrative expenses and amounted to $2.6 million in fiscal 2005, compared to an
immaterial amount of loss in fiscal 2004.
Depreciation and amortization expense increased from $36.8 million in fiscal 2004 to $66.4 million in fiscal
2005. This increase of $29.6 million was due primarily to depreciation of EB’s assets of $22.4 million after the
mergers, with the remaining increase due to capital expenditures for 296 new GameStop stores and management
information systems and the commencement in the third quarter of fiscal 2005 of full operations in the Company’s
new distribution facility. Depreciation and amortization expense will increase from fiscal 2005 to fiscal 2006 due to
the mergers, continued capital expenditures for new stores and management information systems and due to a full
year of depreciation on the Company’s new distribution facility.
The Company’s results of operations for fiscal 2005 include expenses believed to be of a one-time or short-
term nature associated with the mergers, which included $13.6 million included in operating earnings and
$7.5 million included in interest expenses. The $13.6 million included $9.0 million in one-time charges associated
with assets of the Company considered to be impaired because they were redundant as a result of the mergers. The
$7.5 million of merger-related interest expense resulted primarily from a commitment fee of $7.1 million for bridge
33