GameStop 2005 Annual Report Download - page 41
Download and view the complete annual report
Please find page 41 of the 2005 GameStop annual report below. You can navigate through the pages in the report by either clicking on the pages listed below, or by using the keyword search tool below to find specific information within the annual report.-
 1
1 -
2
-
3
-
4
-
5
-
6
-
7
-
8
-
9
-
10
-
11
-
12
-
13
-
14
-
15
-
16
-
17
-
18
-
19
-
20
-
21
-
22
-
23
-
24
-
25
-
26
-
27
-
28
-
29
-
30
-
 31
31 -
 32
32 -
 33
33 -
 34
34 -
 35
35 -
 36
36 -
 37
37 -
 38
38 -
 39
39 -
 40
40 -
 41
41 -
 42
42 -
 43
43 -
 44
44 -
 45
45 -
 46
46 -
 47
47 -
 48
48 -
 49
49 -
 50
50 -
 51
51 -
52
-
53
-
54
-
55
-
56
-
57
-
58
-
59
-
60
-
61
-
62
-
63
-
64
-
65
-
66
-
67
-
68
-
69
-
70
-
71
-
72
-
73
-
74
-
75
-
76
-
77
-
78
-
79
-
80
-
81
-
82
-
83
-
84
-
85
-
86
-
87
-
88
-
89
-
90
-
91
-
92
-
93
-
94
-
95
-
96
-
97
-
98
-
99
-
100
-
101
-
102
-
103
-
104
-
105
-
106
-
107
-
108
-
109
-
110
-
111
-
112
-
113
-
114
-
115
-
116
-
117
-
118
-
119
-
120
 |
 |

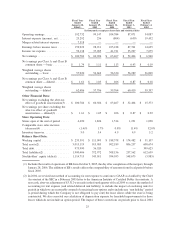
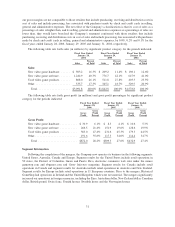
Sales by operating segment in U.S. dollars were as follows (in millions):
Fiscal Year Ended
January 28,
2006
Fiscal Year Ended
January 29,
2005
Fiscal Year Ended
January 31,
2004
United States ........................ $2,709.8 $1,818.2 $1,564.0
Canada ............................ 111.4 — —
Australia ........................... 94.4 — —
Europe ............................ 176.2 24.6 14.8
Total .............................. $3,091.8 $1,842.8 $1,578.8
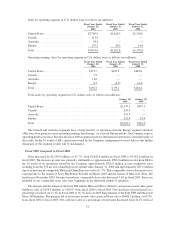
Operating earnings (loss) by operating segment in U.S. dollars were as follows (in millions):
Fiscal Year Ended
January 28,
2006
Fiscal Year Ended
January 29,
2005
Fiscal Year Ended
January 31,
2004
United States ........................ $173.7 $102.1 $104.8
Canada ............................ 7.9 — —
Australia ........................... 11.0 — —
Europe ............................ 0.1 (3.0) (0.4)
Total .............................. $192.7 $ 99.1 $104.4
Total assets by operating segment in U.S. dollars were as follows (in millions):
January 28,
2006
January 29,
2005
United States .............................................. $2,347.1 $897.1
Canada ................................................... 210.4 —
Australia ................................................. 214.7 —
Europe ................................................... 242.9 18.9
Total .................................................... $3,015.1 $916.0
The Canada and Australia segments have a longer history of operations than the Europe segment and their
older store base generates more operating earnings than Europe. As stores in Europe mature, the Company expects
operating profit to increase. Because the fiscal 2005 segment results for international operations consist primarily of
the results for the 16 weeks of EB’s operations owned by the Company, management does not believe that further
discussion of the segment results will be meaningful.
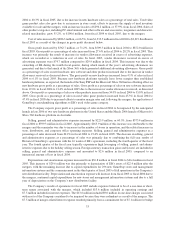
Fiscal 2005 Compared to Fiscal 2004
Sales increased by $1,249.0 million, or 67.7%, from $1,842.8 million in fiscal 2004 to $3,091.8 million in
fiscal 2005. The increase in sales was primarily attributable to approximately $996.8 million in sales from EB for
the 16 weeks of its operations owned by the Company, approximately $216.0 million in non-comparable sales
resulting from the 574 net new GameStop stores opened since January 31, 2004 and approximately $29.6 million
due to an increase in comparable Historical GameStop store sales of 1.7%. This comparable store sales increase was
expected due to the launch of Sony PlayStation Portable in March 2005 and the launch of Microsoft Xbox 360
hardware in November 2005. On a pro forma basis, comparable store sales decreased 1.4% in fiscal 2005. Stores are
included in our comparable store sales base beginning in the thirteenth month of operation.
The mergers and the release of the Sony PSP and the Microsoft Xbox 360 led to an increase in new video game
hardware sales of $294.0 million, or 140.5%, from fiscal 2004 to fiscal 2005. New hardware sales increased as a
percentage of sales from 11.4% in fiscal 2004 to 16.3% in fiscal 2005 due primarily to the Sony PSP and Microsoft
Xbox 360 launches. The mergers led to an increase in new video game software sales of $468.2 million, or 60.3%,
from fiscal 2004 to fiscal 2005. New software sales as a percentage of total sales decreased from 42.1% in fiscal
32