GameStop 2005 Annual Report Download - page 108
Download and view the complete annual report
Please find page 108 of the 2005 GameStop annual report below. You can navigate through the pages in the report by either clicking on the pages listed below, or by using the keyword search tool below to find specific information within the annual report.-
 1
1 -
2
-
3
-
4
-
5
-
6
-
7
-
8
-
9
-
10
-
11
-
12
-
13
-
14
-
15
-
16
-
17
-
18
-
19
-
20
-
21
-
22
-
23
-
24
-
25
-
26
-
27
-
28
-
29
-
30
-
31
-
32
-
33
-
34
-
35
-
36
-
37
-
38
-
39
-
40
-
41
-
42
-
43
-
44
-
45
-
46
-
47
-
48
-
49
-
50
-
51
-
52
-
53
-
54
-
55
-
56
-
57
-
58
-
59
-
60
-
61
-
62
-
63
-
64
-
65
-
66
-
67
-
68
-
69
-
70
-
71
-
72
-
73
-
74
-
75
-
76
-
77
-
78
-
79
-
80
-
81
-
82
-
83
-
84
-
85
-
86
-
87
-
88
-
89
-
90
-
91
-
92
-
93
-
94
-
95
-
96
-
97
-
 98
98 -
 99
99 -
 100
100 -
 101
101 -
 102
102 -
 103
103 -
 104
104 -
 105
105 -
 106
106 -
 107
107 -
 108
108 -
 109
109 -
 110
110 -
 111
111 -
 112
112 -
 113
113 -
 114
114 -
 115
115 -
 116
116 -
 117
117 -
 118
118 -
119
-
120
 |
 |

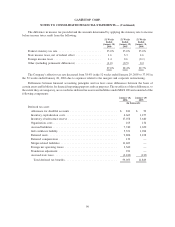
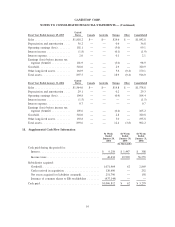
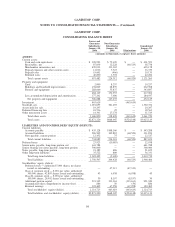
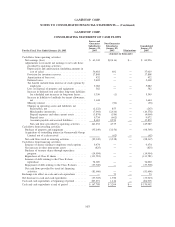
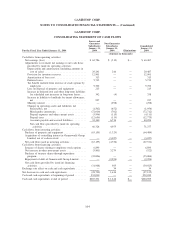
GAMESTOP CORP.
CONSOLIDATING BALANCE SHEET
Issuers and
Guarantor
Subsidiaries
January 29,
2005
Non-Guarantor
Subsidiaries
January 29,
2005 Eliminations
Consolidated
January 29,
2005
(Amounts in thousands, except per share amounts)
ASSETS:
Current assets:
Cash and cash equivalents . . . . . . . . . . . . . . . . . . . . . . $167,788 $ 3,204 $ — $170,992
Receivables, net . . . . . . . . . . . . . . . . . . . . . . . . . . . . . 9,516 296 — 9,812
Merchandise inventories, net. . . . . . . . . . . . . . . . . . . . . 210,634 5,662 — 216,296
Prepaid expenses and other current assets. . . . . . . . . . . . 17,997 403 — 18,400
Prepaid taxes . . . . . . . . . . . . . . . . . . . . . . . . . . . . . . . 2,921 782 — 3,703
Deferred taxes . . . . . . . . . . . . . . . . . . . . . . . . . . . . . . 5,785 — — 5,785
Total current assets . . . . . . . . . . . . . . . . . . . . . . . . . 414,641 10,347 — 424,988
Property and equipment:
Land . . . . . . . . . . . . . . . . . . . . . . . . . . . . . . . . . . . . . 2,000 — — 2,000
Leasehold improvements . . . . . . . . . . . . . . . . . . . . . . . 104,418 2,010 — 106,428
Fixtures and equipment . . . . . . . . . . . . . . . . . . . . . . . . 180,119 4,417 — 184,536
286,537 6,427 — 292,964
Less accumulated depreciation and amortization . . . . . . . 123,791 774 — 124,565
Net property and equipment . . . . . . . . . . . . . . . . . . . 162,746 5,653 — 168,399
Goodwill, net . . . . . . . . . . . . . . . . . . . . . . . . . . . . . . . . . 317,957 2,931 — 320,888
Deferred financing fees . . . . . . . . . . . . . . . . . . . . . . . . . . 566 — — 566
Other noncurrent assets . . . . . . . . . . . . . . . . . . . . . . . . . . 1,629 — (487) 1,142
Total other assets . . . . . . . . . . . . . . . . . . . . . . . . . . . 320,152 2,931 (487) 322,596
Total assets . . . . . . . . . . . . . . . . . . . . . . . . . . . . . . . $897,539 $18,931 $ (487) $915,983
LIABILITIES AND STOCKHOLDERS’ EQUITY (DEFICIT):
Current liabilities:
Accounts payable . . . . . . . . . . . . . . . . . . . . . . . . . . . . $205,014 $ 1,725 $ — $206,739
Accrued liabilities . . . . . . . . . . . . . . . . . . . . . . . . . . . . 78,264 16,719 — 94,983
Note payable, current portion . . . . . . . . . . . . . . . . . . . . 12,173 — — 12,173
Total current liabilities . . . . . . . . . . . . . . . . . . . . . . . 295,451 18,444 — 313,895
Deferred taxes . . . . . . . . . . . . . . . . . . . . . . . . . . . . . . . . 21,257 — — 21,257
Notes payable, long-term portion . . . . . . . . . . . . . . . . . . . 24,347 — — 24,347
Deferred rent and other long-term liabilities . . . . . . . . . . . . 13,473 — — 13,473
Total long-term liabilities . . . . . . . . . . . . . . . . . . . . . 59,077 — — 59,077
Total liabilities . . . . . . . . . . . . . . . . . . . . . . . . . . . . 354,528 18,444 — 372,972
Stockholders’ equity (deficit):
Preferred stock — authorized 5,000 shares; no shares
issued or outstanding . . . . . . . . . . . . . . . . . . . . . . . . — — — —
Class A common stock — $.001 par value; authorized
300,000 shares; 24,189 shares issued . . . . . . . . . . . . . 24 — — 24
Class B common stock — $.001 par value; authorized
100,000 shares; 29,902 shares issued and outstanding. . 30 — — 30
Additional paid-in-capital . . . . . . . . . . . . . . . . . . . . . . . 500,769 3,340 (3,340) 500,769
Accumulated other comprehensive income . . . . . . . . . . . 567 (118) 118 567
Retained earnings . . . . . . . . . . . . . . . . . . . . . . . . . . . . 91,621 (2,735) 2,735 91,621
Treasury stock, at cost, 3,263 shares . . . . . . . . . . . . . . . (50,000) — — (50,000)
Total stockholders’ equity (deficit) . . . . . . . . . . . . . . . 543,011 487 (487) 543,011
Total liabilities and stockholders’ equity (deficit) . . . . . $897,539 $18,931 $ (487) $915,983
99
GAMESTOP CORP.
NOTES TO CONSOLIDATED FINANCIAL STATEMENTS — (Continued)