GameStop 2005 Annual Report Download - page 44
Download and view the complete annual report
Please find page 44 of the 2005 GameStop annual report below. You can navigate through the pages in the report by either clicking on the pages listed below, or by using the keyword search tool below to find specific information within the annual report.-
 1
1 -
2
-
3
-
4
-
5
-
6
-
7
-
8
-
9
-
10
-
11
-
12
-
13
-
14
-
15
-
16
-
17
-
18
-
19
-
20
-
21
-
22
-
23
-
24
-
25
-
26
-
27
-
28
-
29
-
30
-
31
-
32
-
33
-
 34
34 -
 35
35 -
 36
36 -
 37
37 -
 38
38 -
 39
39 -
 40
40 -
 41
41 -
 42
42 -
 43
43 -
 44
44 -
 45
45 -
 46
46 -
 47
47 -
 48
48 -
 49
49 -
 50
50 -
 51
51 -
 52
52 -
 53
53 -
 54
54 -
55
-
56
-
57
-
58
-
59
-
60
-
61
-
62
-
63
-
64
-
65
-
66
-
67
-
68
-
69
-
70
-
71
-
72
-
73
-
74
-
75
-
76
-
77
-
78
-
79
-
80
-
81
-
82
-
83
-
84
-
85
-
86
-
87
-
88
-
89
-
90
-
91
-
92
-
93
-
94
-
95
-
96
-
97
-
98
-
99
-
100
-
101
-
102
-
103
-
104
-
105
-
106
-
107
-
108
-
109
-
110
-
111
-
112
-
113
-
114
-
115
-
116
-
117
-
118
-
119
-
120
 |
 |
products increased from 44.5% in fiscal 2003 to 45.3% in fiscal 2004 due to increased efforts to monitor margin
rates. Gross profit as a percentage of sales on other products remained comparable from fiscal 2003 to fiscal 2004.
Selling, general and administrative expenses increased by $74.2 million, or 24.8%, from $299.2 million in
fiscal 2003 to $373.4 million in fiscal 2004. These increases were primarily attributable to the increase in the
number of stores in operation, and the related increases in store, distribution, and corporate office operating
expenses, the $2.8 million provision for the proposed California labor litigation settlement, the $2.8 million charge
attributable to the professional fees related to the spin-off of our Class B common shares previously owned by
Barnes & Noble and $5.1 million attributable to correcting our method of accounting for rent expense. Selling,
general and administrative expenses as a percentage of sales increased from 19.0% in fiscal 2003 to 20.2% in fiscal
2004. The increase in selling, general and administrative expenses as a percentage of sales was primarily due to the
costs associated with the continued rollout of new stores and the effect these stores have on leveraging of selling,
general and administrative expenses and investments in our international infrastructure (a combined impact of 0.6%
of sales), the provision for the proposed California labor litigation settlement (0.2% of sales), the charge attributable
to the professional fees related to the spin-off of our Class B common shares (0.2% of sales) and correcting our
method of accounting for rent expense (0.3% of sales).
Depreciation and amortization expense increased from $29.4 million in fiscal 2003 to $36.8 million in fiscal
2004. This increase of $7.4 million was due to the capital expenditures for new stores and management information
systems during the fiscal year.
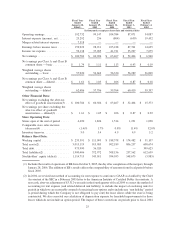
Interest income resulting from the investment of excess cash balances increased from $1.5 million in fiscal
2003 to $1.9 million in fiscal 2004 due to an increase in the level of investments and the average yield on the
investments. Interest expense increased by $1.5 million, from $0.7 million in fiscal 2003 to $2.2 million in fiscal
2004. This increase in interest expense was due to the interest incurred on the note payable to Barnes & Noble in
connection with the repurchase of the Company’s Class B common stock.
Income tax expense decreased by $3.7 million, from $41.7 million in fiscal 2003 to $38.0 million in fiscal
2004. The Company’s effective tax rate decreased from 39.7% in fiscal 2003 to 38.4% in fiscal 2004 due to
corporate restructuring. See Note 12 of “Notes to Consolidated Financial Statements” of the Company for
additional information regarding income taxes.
The factors described above led to a decrease in operating earnings of $5.3 million, from $104.4 million in
fiscal 2003 to $99.1 million in fiscal 2004 and a decrease in net earnings of $2.6 million, or 4.0%, from $63.5 million
in fiscal 2003 to $60.9 million in fiscal 2004.
Liquidity and Capital Resources
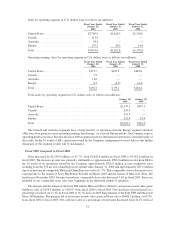
During fiscal 2005, cash provided by operations was $291.4 million, compared to cash provided by operations
of $146.0 million in fiscal 2004 and cash provided by operations of $71.3 million in fiscal 2003. The increase in
cash provided by operations of $145.4 million from fiscal 2004 to fiscal 2005 resulted from an increase in net
income of $39.9 million, primarily due to EB’s results of operations since the mergers; an increase in depreciation
and amortization of $29.7 million due primarily to the mergers; an increase in the growth in accounts payable, net of
growth in merchandise inventories, of $26.8 million caused by growth of the Company and efforts to manage
working capital; an increase in the growth of accrued liabilities of $29.9 million due primarily to increases in
liabilities for customer reservations caused by the growth of the Company; and a net decrease in prepaid expenses of
$19.5 million due primarily to the timing of rent payments at the end of the fiscal 2004.
The increase in cash provided by operations of $74.7 million from fiscal 2003 to fiscal 2004 resulted primarily
from an excess of the growth of accounts payable over the growth in merchandise inventories of $7.3 million during
fiscal 2004 compared to a deficit in the growth of accounts payable compared to the growth in merchandise
inventories of $32.7 million during fiscal 2003. The Company invested in merchandise inventories during fiscal
2003 to prepare for the growth of the Company and store openings in fiscal 2004, with an increase in merchandise
inventories of $72.7 million during fiscal 2003 compared to an increase in accounts payable and accrued liabilities
of $40.0 million during fiscal 2003. In addition, the increase in cash provided by operations from fiscal 2003 to
fiscal 2004 was also due to an increase in depreciation and amortization of $7.5 million, due primarily to growth in
35