GameStop 2005 Annual Report Download - page 33
Download and view the complete annual report
Please find page 33 of the 2005 GameStop annual report below. You can navigate through the pages in the report by either clicking on the pages listed below, or by using the keyword search tool below to find specific information within the annual report.-
 1
1 -
2
-
3
-
4
-
5
-
6
-
7
-
8
-
9
-
10
-
11
-
12
-
13
-
14
-
15
-
16
-
17
-
18
-
19
-
20
-
21
-
22
-
 23
23 -
 24
24 -
 25
25 -
 26
26 -
 27
27 -
 28
28 -
 29
29 -
 30
30 -
 31
31 -
 32
32 -
 33
33 -
 34
34 -
 35
35 -
 36
36 -
 37
37 -
 38
38 -
 39
39 -
 40
40 -
 41
41 -
 42
42 -
 43
43 -
44
-
45
-
46
-
47
-
48
-
49
-
50
-
51
-
52
-
53
-
54
-
55
-
56
-
57
-
58
-
59
-
60
-
61
-
62
-
63
-
64
-
65
-
66
-
67
-
68
-
69
-
70
-
71
-
72
-
73
-
74
-
75
-
76
-
77
-
78
-
79
-
80
-
81
-
82
-
83
-
84
-
85
-
86
-
87
-
88
-
89
-
90
-
91
-
92
-
93
-
94
-
95
-
96
-
97
-
98
-
99
-
100
-
101
-
102
-
103
-
104
-
105
-
106
-
107
-
108
-
109
-
110
-
111
-
112
-
113
-
114
-
115
-
116
-
117
-
118
-
119
-
120
 |
 |

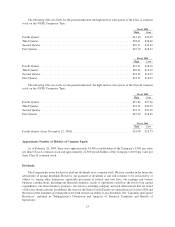
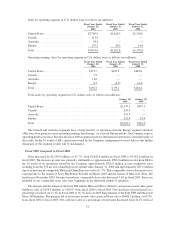
Securities Authorized for Issuance under Equity Compensation Plans
Information for our equity compensation plans in effect as of January 28, 2006, is as follows:
Plan Category
Number of Securities to
be Issued upon Exercise
of Outstanding Options,
Warrants and Rights
(a)
Weighted-Average
Exercise Price of
Outstanding
Options, Warrants
and Rights
(b)
Number of Securities
Remaining Available for
Future Issuance Under
Equity Compensation
Plans (Excluding
Securities Reflected in
Column(a))
(c)
Equity compensation plans approved by
security holders .................... 11,506,000 $ 12.31 3,329,000
Equity compensation plans not approved by
security holders .................... 0 notapplicable 0
Total .............................. 11,506,000 $ 12.31 3,329,000
On February 10, 2006, an additional 1,630,000 options to purchase our Class A common stock at an exercise
price of $41.37 per share and 257,400 shares of restricted stock were granted under our Amended and Restated 2001
Incentive Plan, as amended. These options and restricted shares vest in equal increments over three years and the
options expire on February 9, 2016.
Purchases of Equity Securities by the Issuer and Affiliated Purchasers
There were no repurchases of the Company’s equity securities during the fourth quarter of fiscal 2005. As of
January 28, 2006, the Company had no amount available for purchases under any repurchase program.
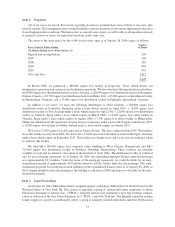
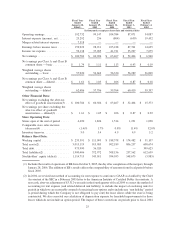
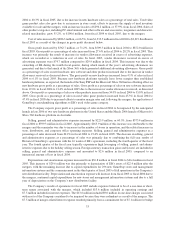
Item 6. Selected Consolidated Financial Data
The following table sets forth our selected consolidated financial and operating data for the periods and at the
dates indicated. Our fiscal year is composed of 52 or 53 weeks ending on the Saturday closest to January 31. The
fiscal years ended January 28, 2006, January 29, 2005, January 31, 2004, February 1, 2003 and February 2, 2002
consisted of 52 weeks. The “Statement of Operations Data” for the fiscal years 2005, 2004 and 2003 and the
“Balance Sheet Data” as of January 28, 2006 and January 29, 2005 are derived from, and are qualified by reference
to, our audited financial statements which are included elsewhere in this Form 10-K. The “Statement of Operations
Data” for fiscal years ended February 1, 2003 and February 2, 2002 and the “Balance Sheet Data” as of January 31,
2004, February 1, 2003 and February 2, 2002 are derived from our audited financial statements which are not
included elsewhere in this Form 10-K.
Our selected financial data set forth below should be read in conjunction with “Management’s Discussion and
Analysis of Financial Condition and Results of Operations” and the consolidated financial statements and notes
thereto included elsewhere in this Form 10-K.
Fiscal Year
Ended
January 28,
2006(1)
Fiscal Year
Ended
January 29,
2005
Fiscal Year
Ended
January 31,
2004
Fiscal Year
Ended
February 1,
2003
Fiscal Year
Ended
February 2,
2002
In thousands, except per share data and statistical data
Statement of Operations Data:
Sales ......................... $3,091,783 $1,842,806 $1,578,838 $1,352,791 $1,121,138
Cost of sales .................... 2,219,753 1,333,506 1,145,893 1,012,145 855,386
Gross profit .................... 872,030 509,300 432,945 340,646 265,752
Selling, general and administrative
expenses(2) ................... 599,343 373,364 299,193 230,461 200,698
Depreciation and amortization(2) ..... 66,355 36,789 29,368 23,114 19,842
Amortization of goodwill .......... — — — — 11,125
Merger-related expenses ........... 13,600 — — — —
24