GameStop 2005 Annual Report Download - page 43
Download and view the complete annual report
Please find page 43 of the 2005 GameStop annual report below. You can navigate through the pages in the report by either clicking on the pages listed below, or by using the keyword search tool below to find specific information within the annual report.-
 1
1 -
2
-
3
-
4
-
5
-
6
-
7
-
8
-
9
-
10
-
11
-
12
-
13
-
14
-
15
-
16
-
17
-
18
-
19
-
20
-
21
-
22
-
23
-
24
-
25
-
26
-
27
-
28
-
29
-
30
-
31
-
32
-
 33
33 -
 34
34 -
 35
35 -
 36
36 -
 37
37 -
 38
38 -
 39
39 -
 40
40 -
 41
41 -
 42
42 -
 43
43 -
 44
44 -
 45
45 -
 46
46 -
 47
47 -
 48
48 -
 49
49 -
 50
50 -
 51
51 -
 52
52 -
 53
53 -
54
-
55
-
56
-
57
-
58
-
59
-
60
-
61
-
62
-
63
-
64
-
65
-
66
-
67
-
68
-
69
-
70
-
71
-
72
-
73
-
74
-
75
-
76
-
77
-
78
-
79
-
80
-
81
-
82
-
83
-
84
-
85
-
86
-
87
-
88
-
89
-
90
-
91
-
92
-
93
-
94
-
95
-
96
-
97
-
98
-
99
-
100
-
101
-
102
-
103
-
104
-
105
-
106
-
107
-
108
-
109
-
110
-
111
-
112
-
113
-
114
-
115
-
116
-
117
-
118
-
119
-
120
 |
 |
financing as a contingency in the event that we were unable to issue the senior notes and senior floating rate notes
prior to the consummation of the mergers.
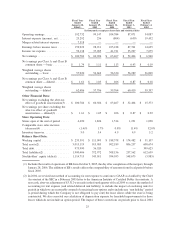
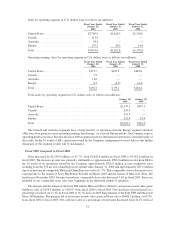
Interest income resulting from the investment of excess cash balances increased from $1.9 million in fiscal
2004 to $5.1 million in fiscal 2005 due to an increase in the average yield on the investments, interest of $0.8 million
earned on the investment of the $941.5 million in proceeds of the offering of the senior notes and the senior floating
rate notes from the issuance date on September 28, 2005 until the date of the mergers on October 8, 2005 and
interest income earned by EB after the mergers on its invested assets. Interest expense increased from $2.2 million
in fiscal 2004 to $30.4 million in fiscal 2005 primarily due to the interest incurred on the $650 million senior notes
payable and the $300 million senior floating rate notes payable and the interest incurred on the note payable to
Barnes & Noble in connection with the repurchase of Historical GameStop’s Class B common stock in fiscal 2004.
Interest expense on the Company’s debt is expected to be approximately $80.0 million in fiscal 2006.
Income tax expense increased by $21.1 million, from $38.0 million in fiscal 2004 to $59.1 million in fiscal
2005. The Company’s effective tax rate decreased from 38.4% in fiscal 2004 to 37.0% in fiscal 2005 due to expenses
related to the mergers and corporate restructuring. See Note 12 of “Notes to Consolidated Financial Statements” of
the Company for additional information regarding income taxes.
The factors described above led to an increase in operating earnings of $93.6 million, from $99.1 million in
fiscal 2004 to $192.7 million in fiscal 2005 and an increase in net earnings of $39.9 million, or 65.5%, from
$60.9 million in fiscal 2004 to $100.8 million in fiscal 2005.
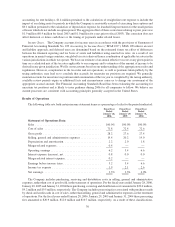
Fiscal 2004 Compared to Fiscal 2003
Sales increased by $264.0 million, or 16.7%, from $1,578.8 million in fiscal 2003 to $1,842.8 million in fiscal
2004. The increase in sales was attributable to the $139.0 million in sales resulting from 338 new stores opened
since January 31, 2004 and the $94.2 million in additional sales from having a full year of sales in fiscal 2004 from
stores that opened in fiscal 2003, compared to a partial year in 2003. Comparable store sales increased a modest
1.7% as increases in video game software sales driven by strong new game releases were offset by declining
hardware price points and hardware shortages caused by insufficient quantities manufactured by hardware vendors.
Stores are included in our comparable store sales base beginning in the thirteenth month of operation.
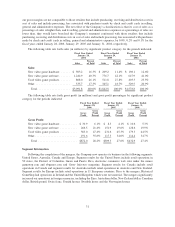
The strong new game releases in fiscal 2004 led to an increase in new video game software sales of
$128.8 million, or 19.9%, from fiscal 2003 and an increase in new software sales as a percentage of total sales from
41.0% in fiscal 2003 to 42.1% in fiscal 2004. The declining price points and hardware shortages described above
curtailed the expected growth in new hardware, resulting in a modest 5.6%, or $11.1 million, increase in sales and a
decline in hardware sales as a percentage of total sales from 12.6% in fiscal 2003 to 11.4% in fiscal 2004. Used
video game products continued to show strong growth, with an increase in sales of $108.5 million, or 26.9%, from
fiscal 2003 to fiscal 2004 and an increase as a percentage of total sales from 25.5% in fiscal 2003 to 27.8% in fiscal
2004. This growth was due to our store growth in strip centers and the availability of used products for sale caused
by trade-ins of used video game products in response to the strong new game releases. Sales of other product
categories, including PC entertainment and other software and accessories, magazines and character-related
merchandise, grew only 4.7%, or $15.6 million, from fiscal 2003 to fiscal 2004, as was expected due to a lack of
strong new PC accessories and trading cards.
Cost of sales increased by $187.6 million, or 16.4%, from $1,145.9 million in fiscal 2003 to $1,333.5 million in
fiscal 2004 as a result of the changes in gross profit discussed below.
Gross profit increased by $76.4 million, or 17.6%, from $432.9 million in fiscal 2003 to $509.3 million in fiscal
2004. Gross profit as a percentage of sales increased from 27.4% in fiscal 2003 to 27.6% in fiscal 2004. This
increase was primarily the result of the shift in sales mix from lower margin new video game hardware to higher
margin new video game software and used video game products, as discussed above. Gross profit as a percentage of
sales on new hardware declined from 5.3% in fiscal 2003 to 4.1% in fiscal 2004 due to the expedited freight costs
incurred in shipping hardware, which was in short supply, into our stores. The expected continued downward
pressure in margin rates on new release titles caused a decline in gross profit as a percentage of sales on new
software from 19.9% in fiscal 2003 to 19.6% in fiscal 2004. Gross profit as a percentage of sales on used video game
34