GameStop 2005 Annual Report Download - page 40
Download and view the complete annual report
Please find page 40 of the 2005 GameStop annual report below. You can navigate through the pages in the report by either clicking on the pages listed below, or by using the keyword search tool below to find specific information within the annual report.-
 1
1 -
2
-
3
-
4
-
5
-
6
-
7
-
8
-
9
-
10
-
11
-
12
-
13
-
14
-
15
-
16
-
17
-
18
-
19
-
20
-
21
-
22
-
23
-
24
-
25
-
26
-
27
-
28
-
29
-
 30
30 -
 31
31 -
 32
32 -
 33
33 -
 34
34 -
 35
35 -
 36
36 -
 37
37 -
 38
38 -
 39
39 -
 40
40 -
 41
41 -
 42
42 -
 43
43 -
 44
44 -
 45
45 -
 46
46 -
 47
47 -
 48
48 -
 49
49 -
 50
50 -
51
-
52
-
53
-
54
-
55
-
56
-
57
-
58
-
59
-
60
-
61
-
62
-
63
-
64
-
65
-
66
-
67
-
68
-
69
-
70
-
71
-
72
-
73
-
74
-
75
-
76
-
77
-
78
-
79
-
80
-
81
-
82
-
83
-
84
-
85
-
86
-
87
-
88
-
89
-
90
-
91
-
92
-
93
-
94
-
95
-
96
-
97
-
98
-
99
-
100
-
101
-
102
-
103
-
104
-
105
-
106
-
107
-
108
-
109
-
110
-
111
-
112
-
113
-
114
-
115
-
116
-
117
-
118
-
119
-
120
 |
 |

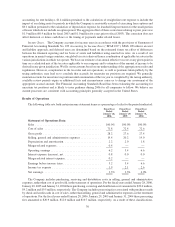
our gross margins are not comparable to those retailers that include purchasing, receiving and distribution costs in
cost of sales and include processing fees associated with purchases made by check and credit cards in selling,
general and administrative expenses. The net effect of the Company’s classifications is that its cost of sales as a
percentage of sales is higher than, and its selling, general and administrative expenses as a percentage of sales are
lower than, they would have been had the Company’s treatment conformed with those retailers that include
purchasing, receiving and distribution costs in cost of sales and include processing fees associated with purchases
made by check and credit cards in selling, general and administrative expenses, by 0.0%, 0.2% and 0.1% for the
fiscal years ended January 28, 2006, January 29, 2005 and January 31, 2004, respectively.
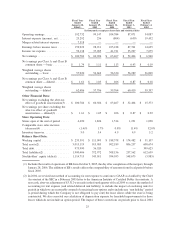
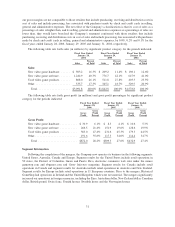
The following table sets forth sales (in millions) by significant product category for the periods indicated:
Sales
Percent
of Total Sales
Percent
of Total Sales
Percent
of Total
Fiscal Year Ended
January 28,
2006
Fiscal Year Ended
January 29,
2005
Fiscal Year Ended
January 31,
2004
Sales:
New video game hardware ...... $ 503.2 16.3% $ 209.2 11.4% $ 198.1 12.6%
New video game software ....... 1,244.9 40.3% 776.7 42.1% 647.9 41.0%
Used video game products ....... 808.0 26.1% 511.8 27.8% 403.3 25.5%
Other ...................... 535.7 17.3% 345.1 18.7% 329.5 20.9%
Total ..................... $3,091.8 100.0% $1,842.8 100.0% $1,578.8 100.0%
The following table sets forth gross profit (in millions) and gross profit percentages by significant product
category for the periods indicated:
Gross
Profit
Gross
Profit
Percent
Gross
Profit
Gross
Profit
Percent
Gross
Profit
Gross
Profit
Percent
Fiscal Year Ended
January 28,
2006
Fiscal Year Ended
January 29,
2005
Fiscal Year Ended
January 31,
2004
Gross Profit:
New video game hardware ........... $ 30.9 6.1% $ 8.5 4.1% $ 10.6 5.3%
New video game software ........... 266.5 21.4% 151.9 19.6% 128.6 19.9%
Used video game products ........... 383.0 47.4% 231.6 45.3% 179.3 44.5%
Other ........................... 191.6 35.8% 117.3 34.0% 114.4 34.7%
Total ......................... $872.0 28.2% $509.3 27.6% $432.9 27.4%
Segment Information
Following the completion of the mergers, the Company now operates its business in the following segments:
United States, Australia, Canada and Europe. Segment results for the United States include retail operations in
50 states, the District of Columbia, Guam and Puerto Rico, electronic commerce web sites under the names
gamestop.com and ebgames.com and Game Informer magazine. Segment results for Canada include retail
operations in Canada and segment results for Australia include retail operations in Australia and New Zealand.
Segment results for Europe include retail operations in 11 European countries. Prior to the mergers, Historical
GameStop had operations in Ireland and the United Kingdom which were not material. The mergers significantly
increased our operations in foreign currencies, including the Euro, Australian dollar, New Zealand dollar, Canadian
dollar, British pound, Swiss franc, Danish kroner, Swedish krona and the Norwegian kroner.
31