GameStop 2005 Annual Report Download - page 104
Download and view the complete annual report
Please find page 104 of the 2005 GameStop annual report below. You can navigate through the pages in the report by either clicking on the pages listed below, or by using the keyword search tool below to find specific information within the annual report.-
 1
1 -
2
-
3
-
4
-
5
-
6
-
7
-
8
-
9
-
10
-
11
-
12
-
13
-
14
-
15
-
16
-
17
-
18
-
19
-
20
-
21
-
22
-
23
-
24
-
25
-
26
-
27
-
28
-
29
-
30
-
31
-
32
-
33
-
34
-
35
-
36
-
37
-
38
-
39
-
40
-
41
-
42
-
43
-
44
-
45
-
46
-
47
-
48
-
49
-
50
-
51
-
52
-
53
-
54
-
55
-
56
-
57
-
58
-
59
-
60
-
61
-
62
-
63
-
64
-
65
-
66
-
67
-
68
-
69
-
70
-
71
-
72
-
73
-
74
-
75
-
76
-
77
-
78
-
79
-
80
-
81
-
82
-
83
-
84
-
85
-
86
-
87
-
88
-
89
-
90
-
91
-
92
-
93
-
 94
94 -
 95
95 -
 96
96 -
 97
97 -
 98
98 -
 99
99 -
 100
100 -
 101
101 -
 102
102 -
 103
103 -
 104
104 -
 105
105 -
 106
106 -
 107
107 -
 108
108 -
 109
109 -
 110
110 -
 111
111 -
 112
112 -
 113
113 -
 114
114 -
115
-
116
-
117
-
118
-
119
-
120
 |
 |

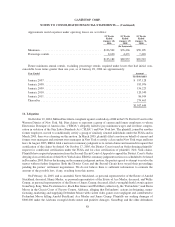
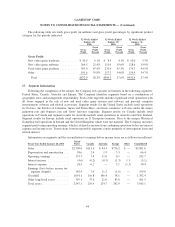
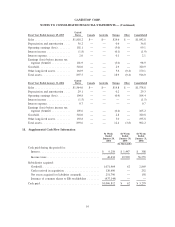
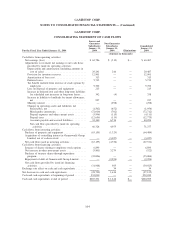
Fiscal Year Ended January 29, 2005
United
States Canada Australia Europe Other Consolidated
Sales ....................... $1,818.2 $— $— $24.6 $ — $1,842.8
Depreciation and amortization .... 36.2 — — 0.6 — 36.8
Operating earnings (loss) ........ 102.1 — — (3.0) — 99.1
Interest income ............... (1.8) — — (0.1) — (1.9)
Interest expense ............... 2.0 — — 0.1 — 2.1
Earnings (loss) before income tax
expense (benefit) . . . ......... 101.9 — — (3.0) — 98.9
Goodwill .................... 318.0 — — 2.9 — 320.9
Other long-lived assets . ......... 164.9 — — 5.6 (0.4) 170.1
Total assets .................. 897.5 — — 18.9 (0.4) 916.0
Fiscal Year Ended January 31, 2004
United
States Canada Australia Europe Other Consolidated
Sales ....................... $1,564.0 $— $— $14.8 $ — $1,578.8
Depreciation and amortization .... 29.1 — — 0.2 — 29.3
Operating earnings (loss) ........ 104.8 — — (0.4) — 104.4
Interest income ............... (1.5) — — — — (1.5)
Interest expense ............... 0.7 — — — — 0.7
Earnings (loss) before income tax
expense (benefit) . . . ......... 105.6 — — (0.4) — 105.2
Goodwill .................... 318.0 — — 2.8 — 320.8
Other long-lived assets . ......... 192.8 — — 3.0 — 195.8
Total assets .................. 893.6 — — 12.4 (3.8) 902.2
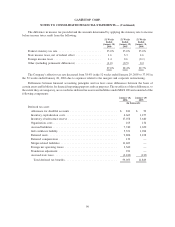
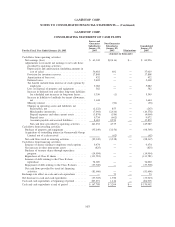
18. Supplemental Cash Flow Information
52 Weeks
Ended
January 28,
2006
52 Weeks
Ended
January 29,
2005
52 Weeks
Ended
January 31,
2004
(In thousands)
Cash paid during the period for:
Interest ...................................... $ 9,258 $ 1,447 $ 308
Income taxes .................................. 40,434 19,903 56,555
Subsidiaries acquired:
Goodwill..................................... 1,071,464 62 2,869
Cash received in acquisition ...................... 120,696 — 252
Net assets acquired (or liabilities assumed). . .......... 251,796 — 158
Issuance of common shares to EB stockholders ........ (437,144) — —
Cash paid ...................................... $1,006,812 $ 62 $ 3,279
95
GAMESTOP CORP.
NOTES TO CONSOLIDATED FINANCIAL STATEMENTS — (Continued)