Energizer 2012 Annual Report Download - page 99
Download and view the complete annual report
Please find page 99 of the 2012 Energizer annual report below. You can navigate through the pages in the report by either clicking on the pages listed below, or by using the keyword search tool below to find specific information within the annual report.-
 1
1 -
2
-
3
-
4
-
5
-
6
-
7
-
8
-
9
-
10
-
11
-
12
-
13
-
14
-
15
-
16
-
17
-
18
-
19
-
20
-
21
-
22
-
23
-
24
-
25
-
26
-
27
-
28
-
29
-
30
-
31
-
32
-
33
-
34
-
35
-
36
-
37
-
38
-
39
-
40
-
41
-
42
-
43
-
44
-
45
-
46
-
47
-
48
-
49
-
50
-
51
-
52
-
53
-
54
-
55
-
56
-
57
-
58
-
59
-
60
-
61
-
62
-
63
-
64
-
65
-
66
-
67
-
68
-
69
-
70
-
71
-
72
-
73
-
74
-
75
-
76
-
77
-
78
-
79
-
80
-
81
-
82
-
83
-
84
-
85
-
86
-
87
-
88
-
 89
89 -
 90
90 -
 91
91 -
 92
92 -
 93
93 -
 94
94 -
 95
95 -
 96
96 -
 97
97 -
 98
98 -
 99
99 -
 100
100 -
 101
101 -
 102
102 -
 103
103 -
 104
104 -
 105
105 -
 106
106 -
 107
107 -
 108
108 -
 109
109 -
110
-
111
-
112
-
113
-
114
-
115
-
116
-
117
-
118
-
119
-
120
-
121
-
122
-
123
-
124
 |
 |

ENERGIZER HOLDINGS, INC.
(Dollars in millions, except per share and percentage data)
(19) Guarantor and Non-Guarantor Financial Information
On May 19, 2011, the Company issued a total of $600.0 of 4.70% senior notes due in May 2021 with interest payable semi-
annually beginning November 2011. On May 24, 2012, the Company issued an additional $500.0 of senior notes with interest
payable semi-annually in May and November at an annual fixed interest rate of 4.70%, maturing in May 2022.
The notes issued in May 2011 and May 2012 (collectively the "Notes") are fully and unconditionally guaranteed on a joint and
several basis by the Company's existing and future direct and indirect domestic subsidiaries that are guarantors of any of the
Company's credit agreements or other indebtedness for borrowed money (the “Guarantors”). The Guarantors are 100% owned
either directly or indirectly by the Company and jointly and severally guarantee the Company's obligations under the Notes and
substantially all of the Company's other outstanding indebtedness. The Company's subsidiaries organized outside of the U.S.
and certain domestic subsidiaries, which are not guarantors of any of the Company's other indebtedness, (collectively, the
“Non-Guarantors”) do not guarantee the Notes. The subsidiary guarantee with respect to the Notes is subject to release upon
sale of all of the capital stock of the Subsidiary Guarantor; if the guarantee under our credit agreements and other indebtedness
for borrowed money is released or discharged (other than due to payment under such guarantee); or when the requirements for
legal defeasance are satisfied or the obligations are discharged in accordance with the indenture.
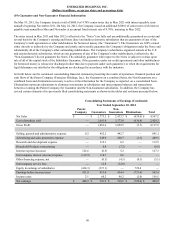
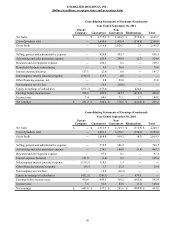
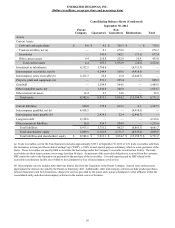
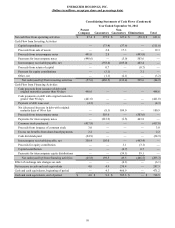
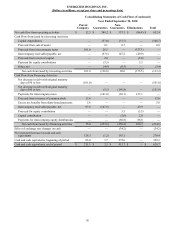
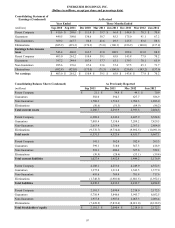
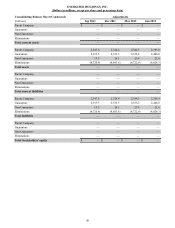
Set forth below are the condensed consolidating financial statements presenting the results of operations, financial position and
cash flows of the Parent Company (Energizer Holdings, Inc.), the Guarantors on a combined basis, the Non-Guarantors on a
combined basis and eliminations necessary to arrive at the information for the Company as reported, on a consolidated basis.
Eliminations represent adjustments to eliminate investments in subsidiaries and intercompany balances and transactions
between or among the Parent Company, the Guarantor and the Non-Guarantor subsidiaries. In addition, the Company has
revised certain elements of its previously filed consolidating statements as shown in the tables and revisions presented below.
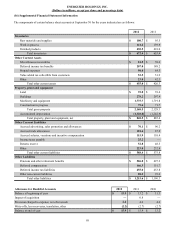
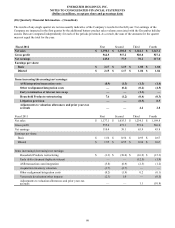
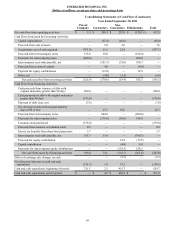
Consolidating Statements of Earnings (Condensed)
Year Ended September 30, 2012
Parent
Company Guarantors
Non-
Guarantors Eliminations Total
Net Sales $ — $ 2,773.5 $ 2,433.3 $ (639.6) $ 4,567.2
Cost of products sold — 1,691.9 1,373.8 (636.4) 2,429.3
Gross Profit — 1,081.6 1,059.5 (3.2) 2,137.9
Selling, general and administrative expense 0.2 452.2 442.7 — 895.1
Advertising and sales promotion expense — 249.9 200.7 (1.1) 449.5
Research and development expense — 112.3 0.2 — 112.5
Household Products restructuring — 0.4 (7.2)—
(6.8)
Interest expense/(income) 122.6 (0.5) 5.2 — 127.3
Intercompany interest (income)/expense (119.5) 118.7 0.8 — —
Other financing expense, net — (0.5)(4.5)(0.1)(5.1)
Intercompany service fees — 12.8 (12.8)— —
Equity in earnings of subsidiaries (414.3)(315.1) — 729.4 —
Earnings before income taxes 411.0 451.4 434.4 (731.4) 565.4
Income taxes 2.1 60.2 96.2 (2.0) 156.5
Net earnings $ 408.9 $ 391.2 $ 338.2 $ (729.4) $ 408.9
89