Energizer 2012 Annual Report Download - page 93
Download and view the complete annual report
Please find page 93 of the 2012 Energizer annual report below. You can navigate through the pages in the report by either clicking on the pages listed below, or by using the keyword search tool below to find specific information within the annual report.-
 1
1 -
2
-
3
-
4
-
5
-
6
-
7
-
8
-
9
-
10
-
11
-
12
-
13
-
14
-
15
-
16
-
17
-
18
-
19
-
20
-
21
-
22
-
23
-
24
-
25
-
26
-
27
-
28
-
29
-
30
-
31
-
32
-
33
-
34
-
35
-
36
-
37
-
38
-
39
-
40
-
41
-
42
-
43
-
44
-
45
-
46
-
47
-
48
-
49
-
50
-
51
-
52
-
53
-
54
-
55
-
56
-
57
-
58
-
59
-
60
-
61
-
62
-
63
-
64
-
65
-
66
-
67
-
68
-
69
-
70
-
71
-
72
-
73
-
74
-
75
-
76
-
77
-
78
-
79
-
80
-
81
-
82
-
 83
83 -
 84
84 -
 85
85 -
 86
86 -
 87
87 -
 88
88 -
 89
89 -
 90
90 -
 91
91 -
 92
92 -
 93
93 -
 94
94 -
 95
95 -
 96
96 -
 97
97 -
 98
98 -
 99
99 -
 100
100 -
 101
101 -
 102
102 -
 103
103 -
104
-
105
-
106
-
107
-
108
-
109
-
110
-
111
-
112
-
113
-
114
-
115
-
116
-
117
-
118
-
119
-
120
-
121
-
122
-
123
-
124
 |
 |
ENERGIZER HOLDINGS, INC.
(Dollars in millions, except per share and percentage data)
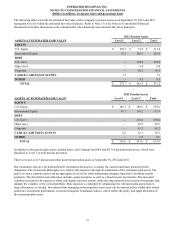
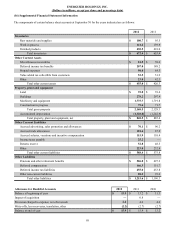
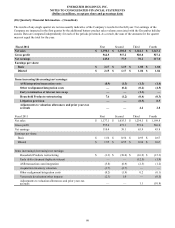
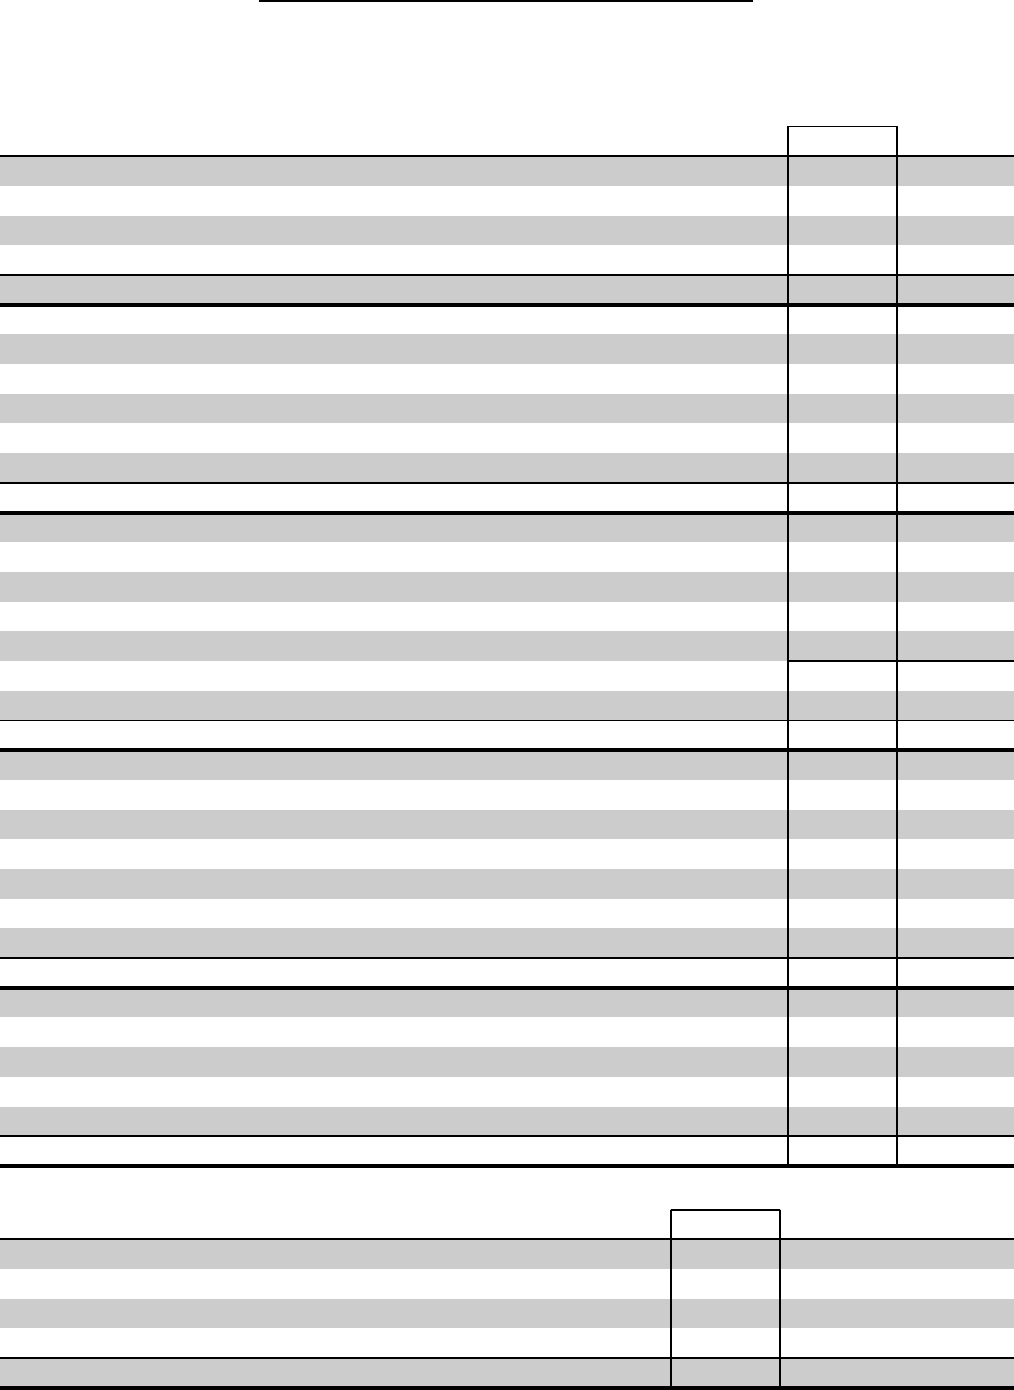
(16) Supplemental Financial Statement Information
The components of certain balance sheet accounts at September 30 for the years indicated are as follows:
2012 2011
Inventories
Raw materials and supplies $ 100.7 $ 95.5
Work in process 141.2 139.9
Finished products 430.5 418.0
Total inventories $ 672.4 $ 653.4
Other Current Assets
Miscellaneous receivables $ 81.5 $ 58.6
Deferred income tax benefits 207.0 189.2
Prepaid expenses 90.0 84.3
Value added tax collectible from customers 53.5 51.9
Other 23.0 42.3
Total other current assets $ 455.0 $ 426.3
Property, plant and equipment
Land $ 39.0 $ 39.4
Buildings 278.2 297.4
Machinery and equipment 1,775.7 1,719.8
Construction in progress 75.6 71.7
Total gross property 2,168.5 2,128.3
Accumulated depreciation (1,320.0)(1,242.9)
Total property, plant and equipment, net $ 848.5 $ 885.4
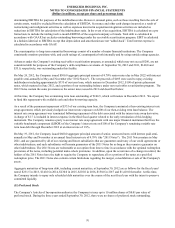
Other Current Liabilities
Accrued advertising, sales promotion and allowances $ 70.1 $ 96.2
Accrued trade allowances 101.4 87.9
Accrued salaries, vacations and incentive compensation 115.9 110.4
Income taxes payable 25.2 —
Returns reserve 52.8 48.5
Other 223.0 232.8
Total other current liabilities $ 588.4 $ 575.8
Other Liabilities
Pensions and other retirement benefits $ 506.0 $ 497.2
Deferred compensation 166.3 151.7
Deferred income tax liabilities 455.0 453.8
Other non-current liabilities 88.3 93.6
Total other liabilities $ 1,215.6 $ 1,196.3
Allowance for Doubtful Accounts 2012 2011 2010
Balance at beginning of year $ 15.9 $ 13.2 $ 11.3
Impact of acquisition —0.8 —
Provision charged to expense, net of reversals 2.2 4.6 4.6
Write-offs, less recoveries, translation, other (2.2)(2.7)(2.7)
Balance at end of year $ 15.9 $ 15.9 $ 13.2
83