Energizer 2012 Annual Report Download - page 66
Download and view the complete annual report
Please find page 66 of the 2012 Energizer annual report below. You can navigate through the pages in the report by either clicking on the pages listed below, or by using the keyword search tool below to find specific information within the annual report.-
 1
1 -
2
-
3
-
4
-
5
-
6
-
7
-
8
-
9
-
10
-
11
-
12
-
13
-
14
-
15
-
16
-
17
-
18
-
19
-
20
-
21
-
22
-
23
-
24
-
25
-
26
-
27
-
28
-
29
-
30
-
31
-
32
-
33
-
34
-
35
-
36
-
37
-
38
-
39
-
40
-
41
-
42
-
43
-
44
-
45
-
46
-
47
-
48
-
49
-
50
-
51
-
52
-
53
-
54
-
55
-
 56
56 -
 57
57 -
 58
58 -
 59
59 -
 60
60 -
 61
61 -
 62
62 -
 63
63 -
 64
64 -
 65
65 -
 66
66 -
 67
67 -
 68
68 -
 69
69 -
 70
70 -
 71
71 -
 72
72 -
 73
73 -
 74
74 -
 75
75 -
 76
76 -
77
-
78
-
79
-
80
-
81
-
82
-
83
-
84
-
85
-
86
-
87
-
88
-
89
-
90
-
91
-
92
-
93
-
94
-
95
-
96
-
97
-
98
-
99
-
100
-
101
-
102
-
103
-
104
-
105
-
106
-
107
-
108
-
109
-
110
-
111
-
112
-
113
-
114
-
115
-
116
-
117
-
118
-
119
-
120
-
121
-
122
-
123
-
124
 |
 |
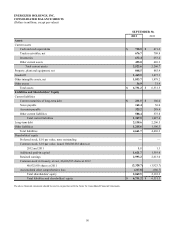
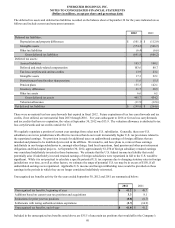
ENERGIZER HOLDINGS, INC.
CONSOLIDATED BALANCE SHEETS
(Dollars in millions, except par values)
SEPTEMBER 30,
2012 2011
Assets
Current assets
Cash and cash equivalents $ 718.5 $ 471.2
Trade receivables, net 676.7 709.8
Inventories 672.4 653.4
Other current assets 455.0 426.3
Total current assets 2,522.6 2,260.7
Property, plant and equipment, net 848.5 885.4
Goodwill 1,469.5 1,475.3
Other intangible assets, net 1,853.7 1,878.2
Other assets 36.9 31.9
Total assets $ 6,731.2 $ 6,531.5
Liabilities and Shareholders' Equity
Current liabilities
Current maturities of long-term debt $ 231.5 $ 106.0
Notes payable 162.4 56.0
Accounts payable 325.2 289.6
Other current liabilities 588.4 575.8
Total current liabilities 1,307.5 1,027.4
Long-term debt 2,138.6 2,206.5
Other liabilities 1,215.6 1,196.3
Total liabilities 4,661.7 4,430.2
Shareholders' equity
Preferred stock, $.01 par value, none outstanding ——
Common stock, $.01 par value, issued 108,008,682 shares at
2012 and 2011 1.1 1.1
Additional paid-in capital 1,621.7 1,593.6
Retained earnings 2,993.2 2,613.0
Common stock in treasury, at cost, 46,486,595 shares at 2012
40,932,950 shares at 2011 (2,328.7)(1,925.7)
Accumulated other comprehensive loss (217.8)(180.7)
Total shareholders' equity 2,069.5 2,101.3
Total liabilities and shareholders' equity $ 6,731.2 $ 6,531.5
The above financial statements should be read in conjunction with the Notes To Consolidated Financial Statements.
56