Energizer 2012 Annual Report Download - page 102
Download and view the complete annual report
Please find page 102 of the 2012 Energizer annual report below. You can navigate through the pages in the report by either clicking on the pages listed below, or by using the keyword search tool below to find specific information within the annual report.-
 1
1 -
2
-
3
-
4
-
5
-
6
-
7
-
8
-
9
-
10
-
11
-
12
-
13
-
14
-
15
-
16
-
17
-
18
-
19
-
20
-
21
-
22
-
23
-
24
-
25
-
26
-
27
-
28
-
29
-
30
-
31
-
32
-
33
-
34
-
35
-
36
-
37
-
38
-
39
-
40
-
41
-
42
-
43
-
44
-
45
-
46
-
47
-
48
-
49
-
50
-
51
-
52
-
53
-
54
-
55
-
56
-
57
-
58
-
59
-
60
-
61
-
62
-
63
-
64
-
65
-
66
-
67
-
68
-
69
-
70
-
71
-
72
-
73
-
74
-
75
-
76
-
77
-
78
-
79
-
80
-
81
-
82
-
83
-
84
-
85
-
86
-
87
-
88
-
89
-
90
-
91
-
 92
92 -
 93
93 -
 94
94 -
 95
95 -
 96
96 -
 97
97 -
 98
98 -
 99
99 -
 100
100 -
 101
101 -
 102
102 -
 103
103 -
 104
104 -
 105
105 -
 106
106 -
 107
107 -
 108
108 -
 109
109 -
 110
110 -
 111
111 -
 112
112 -
113
-
114
-
115
-
116
-
117
-
118
-
119
-
120
-
121
-
122
-
123
-
124
 |
 |
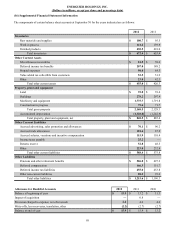
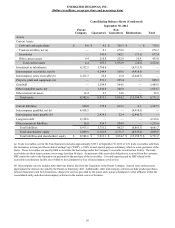
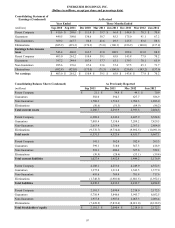
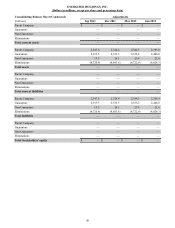
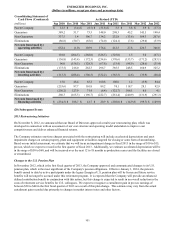
ENERGIZER HOLDINGS, INC.
(Dollars in millions, except per share and percentage data)
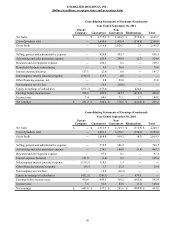
Consolidating Balance Sheets (Condensed)
September 30, 2011
Parent
Company Guarantors
Non-
Guarantors Eliminations Total
Assets
Current Assets
Cash and cash equivalents $ — $ 4.3 $ 466.9 $ — $ 471.2
Trade receivables, net (a) (c) — 15.3 694.5 — 709.8
Inventories — 318.7 363.8 (29.1) 653.4
Other current assets (c) 21.1 243.7 183.0 (21.5) 426.3
Total current assets 21.1 582.0 1,708.2 (50.6) 2,260.7
Investment in subsidiaries 6,177.9 1,430.6 — (7,608.5)—
Intercompany receivables, net (b) — 4,046.7 13.4 (4,060.1)—
Intercompany notes receivable (b) 2,347.6 24.4 5.9 (2,377.9)—
Property, plant and equipment, net — 574.8 310.6 — 885.4
Goodwill — 1,105.0 370.3 — 1,475.3
Other intangible assets, net — 1,664.3 213.9 — 1,878.2
Other noncurrent assets 10.4 11.1 10.4 — 31.9
Total assets 8,557.0 9,438.9 2,632.7 (14,097.1) 6,531.5
Current liabilities (c) 141.1 399.1 518.1 (30.9) 1,027.4
Intercompany payables, net (b) 4,060.1 — — (4,060.1)—
Intercompany notes payable (b) — 2,353.5 24.4 (2,377.9)—
Long-term debt 2,206.5———2,206.5
Other noncurrent liabilities 48.0 975.9 172.4 — 1,196.3
Total liabilities 6,455.7 3,728.5 714.9 (6,468.9) 4,430.2
Total shareholders' equity 2,101.3 5,710.4 1,917.8 (7,628.2) 2,101.3
Total liabilities and shareholders' equity $ 8,557.0 $ 9,438.9 $ 2,632.7 $ (14,097.1) $ 6,531.5
(a) Trade receivables, net for the Non-Guarantors includes approximately $373.0 at September 30, 2011 of U.S. trade receivables sold from
the Guarantors to Energizer Receivables Funding Corp ("ERF"), a 100% owned, special purpose subsidiary, which is a non-guarantor of the
Notes. These receivables are used by ERF to securitize the borrowings under the Company's receivable securitization facility. The trade
receivables are short-term in nature (on average less than 90 days). As payment of the receivable obligation is received from the customer,
ERF remits the cash to the Guarantors in payment for the purchase of the receivables. Cost and expenses paid by ERF related to the
receivable securitization facility are re-billed to the Guarantors by way of intercompany services fees.
(b) Intercompany activity includes notes that bear interest due from the Guarantors to the Parent Company. Interest rates on these notes
approximate the interest rates paid by the Parent on third party debt. Additionally, other intercompany activities include product purchases
between Guarantors and Non-Guarantors, charges for services provided by the parent and various subsidiaries to other affiliates within the
consolidated entity and other intercompany activities in the normal course of business.
(c) The Company has made two reclassifications for financial reporting purposes that impact the balance sheets only. See Note 10 for further
information.
92