Energizer 2012 Annual Report Download - page 98
Download and view the complete annual report
Please find page 98 of the 2012 Energizer annual report below. You can navigate through the pages in the report by either clicking on the pages listed below, or by using the keyword search tool below to find specific information within the annual report.-
 1
1 -
2
-
3
-
4
-
5
-
6
-
7
-
8
-
9
-
10
-
11
-
12
-
13
-
14
-
15
-
16
-
17
-
18
-
19
-
20
-
21
-
22
-
23
-
24
-
25
-
26
-
27
-
28
-
29
-
30
-
31
-
32
-
33
-
34
-
35
-
36
-
37
-
38
-
39
-
40
-
41
-
42
-
43
-
44
-
45
-
46
-
47
-
48
-
49
-
50
-
51
-
52
-
53
-
54
-
55
-
56
-
57
-
58
-
59
-
60
-
61
-
62
-
63
-
64
-
65
-
66
-
67
-
68
-
69
-
70
-
71
-
72
-
73
-
74
-
75
-
76
-
77
-
78
-
79
-
80
-
81
-
82
-
83
-
84
-
85
-
86
-
87
-
 88
88 -
 89
89 -
 90
90 -
 91
91 -
 92
92 -
 93
93 -
 94
94 -
 95
95 -
 96
96 -
 97
97 -
 98
98 -
 99
99 -
 100
100 -
 101
101 -
 102
102 -
 103
103 -
 104
104 -
 105
105 -
 106
106 -
 107
107 -
 108
108 -
109
-
110
-
111
-
112
-
113
-
114
-
115
-
116
-
117
-
118
-
119
-
120
-
121
-
122
-
123
-
124
 |
 |

ENERGIZER HOLDINGS, INC.
NOTES TO CONSOLIDATED FINANCIAL STATEMENTS
(Dollars in millions, except per share and percentage data)
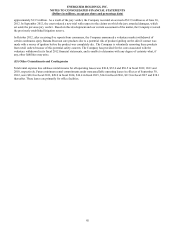
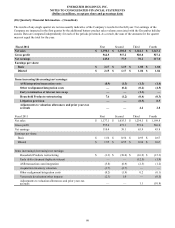
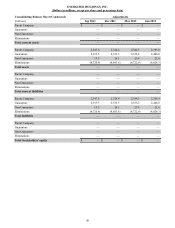
(18) Quarterly Financial Information – (Unaudited)
The results of any single quarter are not necessarily indicative of the Company’s results for the full year. Net earnings of the
Company are impacted in the first quarter by the additional battery product sales volume associated with the December holiday
season. Data are computed independently for each of the periods presented. As a result, the sum of the amounts for the quarter
may not equal the total for the year.
Fiscal 2012 First Second Third Fourth
Net sales $ 1,198.1 $ 1,101.8 $ 1,124.1 $ 1,143.2
Gross profit 564.5 517.2 528.8 527.4
Net earnings 143.8 77.9 70.2 117.0
Earnings per share:
Basic $ 2.17 $ 1.19 $ 1.08 $ 1.86
Diluted $ 2.15 $ 1.17 $ 1.06 $ 1.84
Items increasing/(decreasing) net earnings:
ASR integration/transaction costs (0.9)(1.5)(1.5)(1.4)
Other realignment/integration costs — (0.2)(0.2)(4.5)
Early termination of interest rate swap — — (1.1)—
Household Products restructuring 7.6 (1.2)(0.4)(0.3)
Litigation provision — — (8.5) 8.5
Adjustments to valuation allowances and prior years tax
accruals — — 4.2 2.8
Fiscal 2011 First Second Third Fourth
Net sales $ 1,177.1 $ 1,035.3 $ 1,234.5 $ 1,198.8
Gross profit 555.6 471.1 573.0 546.0
Net earnings 110.4 39.1 65.9 45.8
Earnings per share:
Basic $ 1.56 $ 0.56 $ 0.95 $ 0.67
Diluted $ 1.55 $ 0.55 $ 0.94 $ 0.67
Items increasing/(decreasing) net earnings:
Household Products restructuring $ (1.3)$ (30.0)$ (16.9)$ (15.3)
Early debt retirement/duplicate interest — — (12.5)(1.9)
ASR transaction costs/integration (3.8)(0.9)(2.5)(1.2)
Acquisition inventory valuation (1.7)(2.7)— —
Other realignment/integration costs (0.2)(1.9) 0.2 (0.1)
Venezuela devaluation/other impacts (2.3) 1.0 — (0.5)
Adjustments to valuation allowances and prior years tax
accruals — — 1.1 (10.8)
88